

XRPUSD Medium-term Trend: Bearish
Supply Levels: $0.60, $0.59, $0.58
Demand levels: $0.54, $0.55, $0.56
The price of Ripple has a bearish outlook in the weekly chart. The 50-day moving average and 20-day moving average are trending southward confirming price decline.
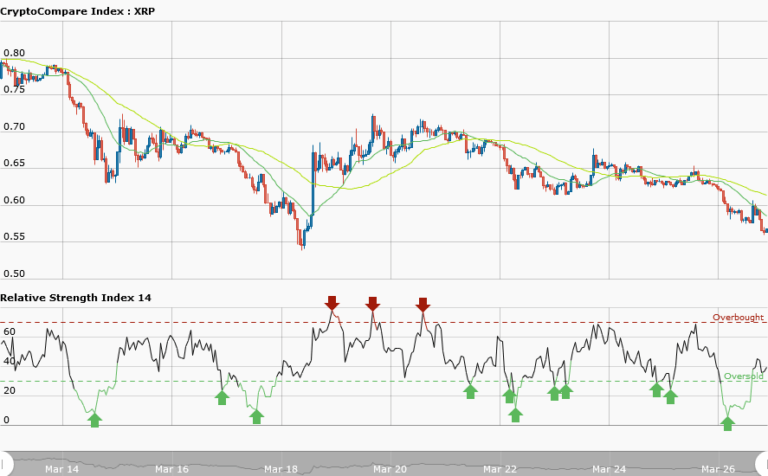
Traders should take a short trade if the demand levels are broken. However, if price could not break the demand levels then price will continue its range bound movement.Meanwhile, the RSI period 14 is level 39 which indicates that the market is nearing the oversold market condition.
XRPUSD Short-term Trend: Bearish

Ripple price is bearish in the daily chart. The price fell to the low of $0.56 and started retracing. We understand that those retracements bring about resistance levels in a downtrend where traders can place short trades. However, retracements should not be confused with reversal of price. Meanwhile, the RSI period14 is level 52 indicates that price is in the range bound zone.
The views and opinions expressed here do not reflect that of CryptoGlobe.com and do not constitute financial advice. Always do your own research


