

XRPUSD Medium-term Trend: Ranging
Supply Levels: $0.73, $0.72, $0.71
Demand levels: $0.67, $0.68, $0.69
Ripple Price Key Highlights:
- Ripple price has broken the bullish trend line.
- Price in a range bound movement.
- Technical indicator price analysis
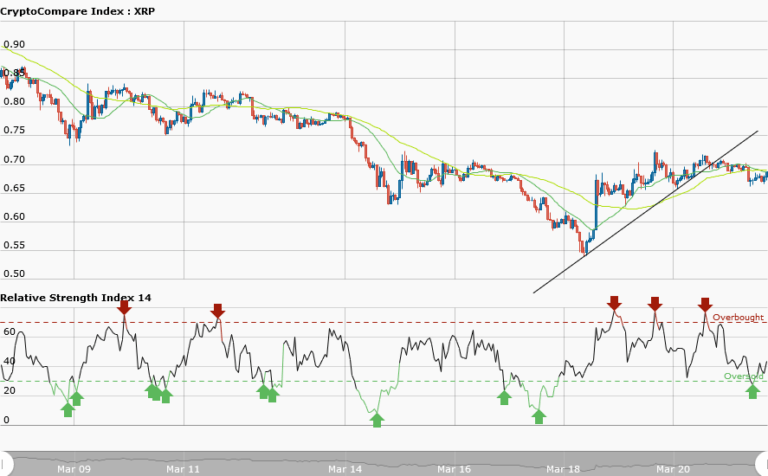
From the weekly chart, the price of Ripple was in a bullish trend yesterday. However, Ripple price broke the trend line and the candlestick closed on the opposite of the trend line. This breakout ends the current bullish trend and commences a range bound movement. In a range bound movement neither the bulls nor the bears have control of the market.
A ranging market usually results to a breakout. However, the RSI period 14 is level 35 which indicates that the market is oversold suggesting bulls taking control of the market. Now if the bulls take control of the market and break the resistance level, traders should place long trades in order to profit from the breakout.
XRPUSD Short-term Trend: Ranging

In the daily chart, we have the price of Ripple in a ranging market. Ripple is oscillating between the resistance at $0.70 and support at $0.67. The price does not range evenly between the key levels. The direction of the market is not discernible therefore traders should abstain from trading. Meanwhile, the RSI period 14 is level 63 which indicates that the price is in the bullish trend zone.


