
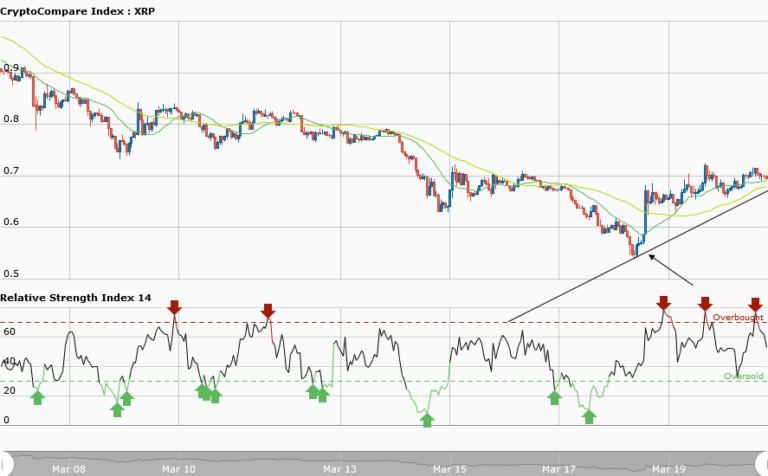

XRPUSD Medium-term Trend: Bullish
Supply Levels: $0.73, $0.72, $0.71
Demand levels: $0.67, $0.68, $0.69
Ripple price is in a bullish market and trading at $0.69 as at the time of writing. The XRPUSD pair is making higher highs and higher lows. From the weekly and daily chart I have the following deliberations: Firstly, place your long orders at the support levels as designated by the arrows. Secondly, if there is no trend line look for price retracement or downward corrections from the price action to place your long trades as the price pulls back.
Thirdly, put a stop loss of 100 pips below the support level because of the volatility of the market. Fourthly, the RSI period 14 is level 53 which indicates that the average gains are higher than average losses. Fifthly, exit all your bullish orders as soon as price breaks the bullish trend line and the candlestick closed on the opposite of the trend line.
XRPUSD Short-term Trend: Bullish

In the daily chart, the price of Ripple is in a bullish market with a trend line showing the support levels of price. However, from the daily chart Ripple price has broken the bullish trend line and the candlestick closed on the opposite of the trend line. The implication is that the current uptrend has come to an end. Traders should close Ripple positions.
Meanwhile, the RSI period 14 is level 36 which indicates that the market is oversold suggesting bulls taking over the market.


