

XRPUSD Medium-term Trend: Bullish
Supply Levels: $0.74, $0.72, $0.70
Demand levels: $0.62, $0.64, $0.66
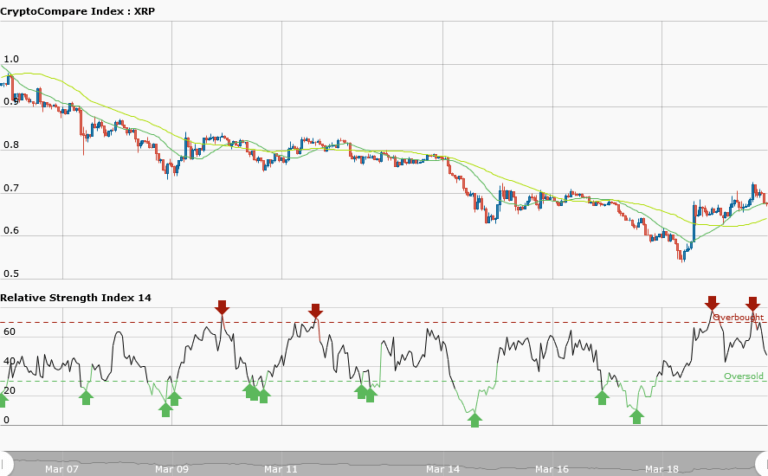
Yesterday, from the weekly chart the XRPUSD pair was in a downtrend with trend line showing the resistance levels of price. The price of Ripple broke the bearish trend line to end the downtrend and commenced a bullish trend. The XRPUSD pair is currently trading at $0.67. Today, the 20-day moving average is above the 50-day moving average indicating that Ripple price is rising.
However, the RSI period 14 is level 47 which indicates that the price is in the range bound zone.
XRPUSD Short-term Trend: Bullish

In the daily chart, the price of Ripple was rising after the breakout. The price was making higher highs and higher lows signaling an uptrend but later there was a price retracement. The 50-day moving average and 20-day moving average are all trending northwards. To get started in a bull market a trader should buy low and sell high. In a bull market the market will always retrace, therefore watch out for retracement or downward correction.
When those set ups appear you should initiate long trades as the price pull back to its support level. However, the RSI period 14 is level 29 which indicates that the market is oversold suggesting bulls to take control of the market.


