

XRPUSD Medium-term Trend: Ranging
Supply Levels: $0.72, $0.71, $0.70
Demand levels: $0.66, $0.67, $0.68
Yesterday, Ripple price broke the support level of $0.75 and fell to a low of $0.64. Also, the RSI period 14 was level 28 which indicated that the market was oversold suggesting bulls taking over the market. In the same vein, bearish traders were advised to exit their positions. Today, the price of Ripple has retraced from the low to break the bearish trend line and commence another trend.
This brings to an end the current downtrend. However, the price of Ripple is now in a range bound market which may continue for some days. However, the RSI period 14 is level 61 which indicates that the price is in the bullish trend zone.
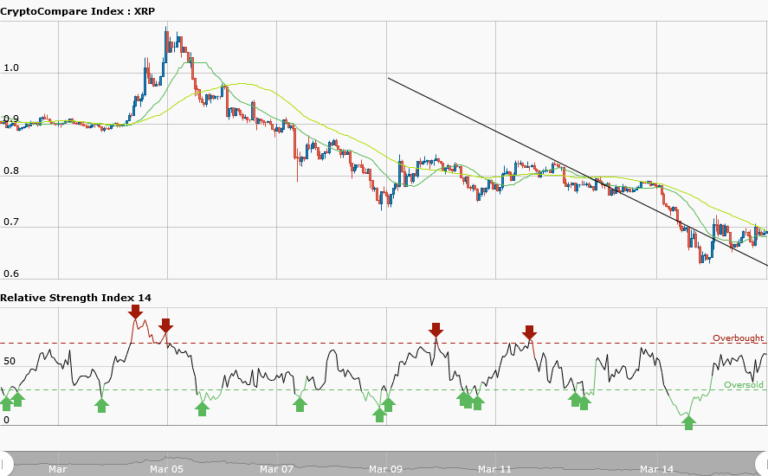
XRPUSD Short-term Trend: Ranging

Yesterday, the daily chart shows Ripple price in a smooth downtrend with a bearish trend line showing the resistance levels where traders can take short trades. Today it is trading in a range bound market between two key levels. The price at $0.70 is the resistance while the price at $0.66 is the support. The daily chart has a choppy price action. However, the RSI period 14 is level 42 which indicates that the price is in the range market zone.


