

XRPUSD Medium-term Trend: Ranging
Supply Levels: $0.81, $0.80, $0.79
Demand levels: $0.75, $0.76, $0.77
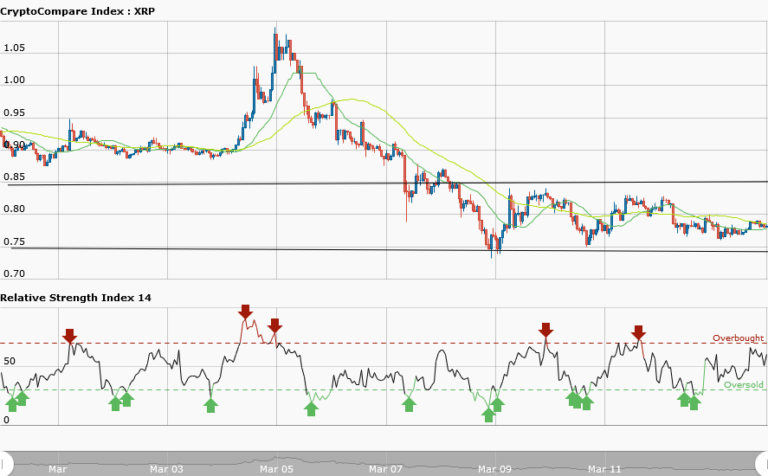
The XRPUSD pair had been in sideways movement for some days. Since on March 9, Ripple had tested the support level once where the price got stalled after the selloff. The support is the price at $0.75 while the resistance is the price at $0.85. If the price breaks the support level it will fall to as low as $0.60 but if it breaks the resistance level it will rally to the previous high of $0.90.
Meanwhile, the RSI period 14 is level 60 confirming that the price is in the sideways trend zone.
XRPUSD Short-term Trend: Ranging

In the short term trend, Ripple is in a sideways movement. The price at $0.79 is the resistance level whereas the price at $0.76 is the support .The price tested both levels thrice.The daily chart has a choppy price action; and it is not evenly apart between the resistance and the support. It is risky therefore to trade the sideways trend.
However, the RSI period 14 is level 54 which indicates that the average gains are higher than average losses.


