
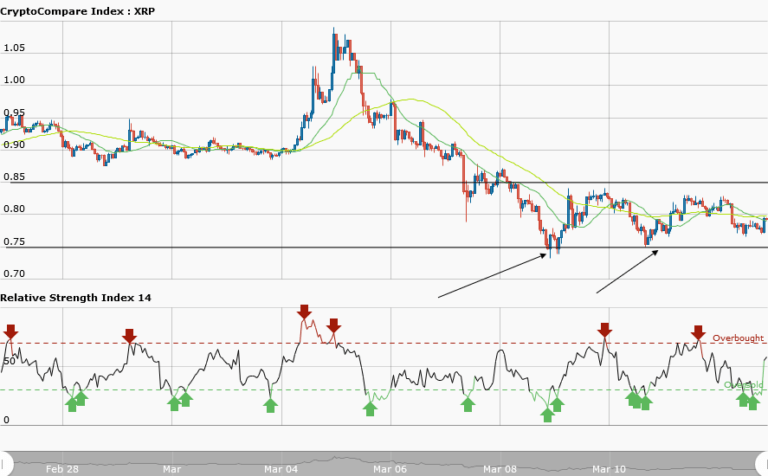

XRPUSD Medium-term Trend: Sideways
Supply Levels: $0.83, $0.82, $0.81
Demand levels: $0.76, $0.77, $0.78
Yesterday, March 12, XRPUSD pair was moving in a sideways (ranging) trend. The price was oscillating between the support at $0.75 and the resistance at $0.85 and the RSI indicator confirms that the price is in the sideways trend zone. Today, Ripple is still in a sideways trend, trading at $0.78. Since the sideways trend is ranging you may wish to trade it.
If the price is getting to the support level and it didn’t break that level you can take a long position and exit near the resistance zone. Similarly, take a short order at the resistance level and exit near the support zone. Meanwhile, the RSI period 14 is level 57 which indicates that average gains are higher than average losses.
XRPUSD Short-term Trend: Sideways

Yesterday, in the daily chart, Ripple was in a bullish trend and a bullish trend line was drawn to show the support levels where traders can take long trades. However, I said that if the price break the bullish trend line that would end the current trend. Yesterday the price fell and broke the trend line to form a sideways trend. Meanwhile, the RSI period 14 is level 60 confirming that the price is in the bullish trend zone.


