

XRPUSD Medium-term Trend: Sideways
Supply Levels: $0.83, $0.82, $0.81
Demand levels: $0.77, $0.78 $0.79
Last week Monday, ripple price was in a bullish market trading at $1.06. However, it was under under the control of the bears on Tuesday, Wednesday, Thursday and Friday trading at $0.74.In the words, a decline in price of about 30% which was caused by negative news.
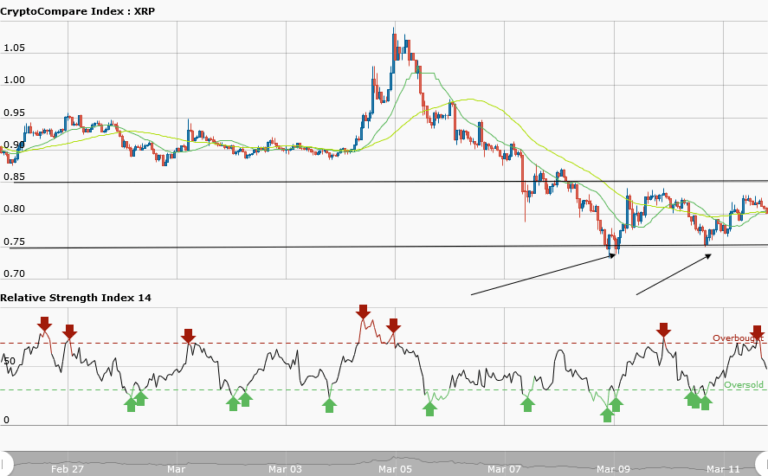
From the weekly chart, XRPUSD pair is moving in a sideways (ranging) market. The price at $0.75 is the support where the price got stalled last Friday. The resistance level is the price at $0.85. If you have followed the sideways trend from its inception last Friday, you are expected to place a long trade at the support and exit near the resistance zone.
The orders should match the numbers of arrows. However, the RSI period 14 is level 47 which indicates that the price is in the sideways trend zone.
XRPUSD Short-term Trend: Bullish

In the short term trend, XRPUSD pair is in a bullish market showing the support levels where you can place long trades. However, the ripple price has broken the bullish trend line this will bring about a reversal in the bullish trend. The RSI period 14 is level 37 which indicates that the market has reached the oversold condition.


