

LTCUSD Medium-term Trend: Sideways
Resistance: $212, $211, $210
Support: $206, $207, $208
From the weekly chart, the market is horizontal and flat as the case was yesterday; though some of the crypto currencies prices are falling. When the price of a pair is rising or declining the chances of trading becomes possible. In this case the key levels of the market are not evenly apart because of the choppy price action. We wait and trade the market when it is either rising or falling in prices.
However, 50-day moving average and 20-day moving average are trending horizontally and the RSI period 14 is level 24 which indicates that the market is oversold suggesting that bulls will take over the market.
LTCUSD Short-term Trend: Sideways

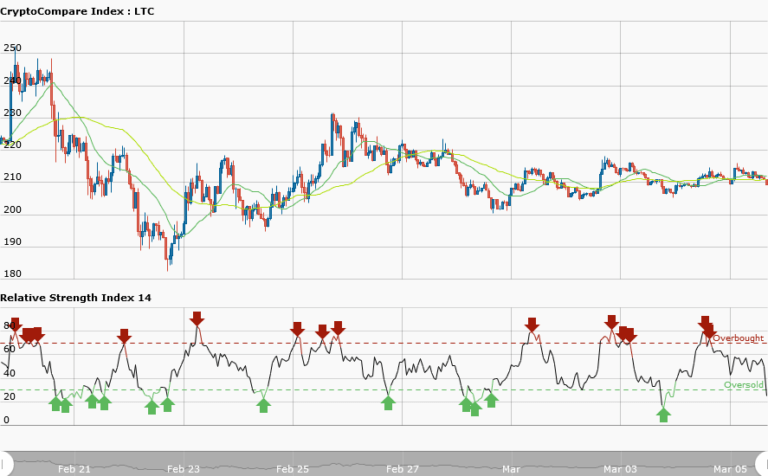
In the short term trend litecoin is also in a sideways movement. The sideways has a choppy price action. You can see the price testing the resistance level at $213 and also price testing the support level of $211. You can trade this sideways market even though the key levels are very close. Take short trade at the resistance and exit near the support zone. Similarly, take long at the support and exit near the resistance zone.
The moving averages are trending sideways whereas the RSI is period 14 is level 18 which indicates that the market is oversold suggesting that bulls will take over the market.


