

LTCUSD Medium-term Trend: Sideways
Resistance: $217, $216, $215
Support: $211, $212, $213
Last week the LTCUSD pair is either falling in price or in a sideways movement. This was responsible for the fluctuation of litecoin price from between $200 and $225 but currently trading at $213.82.
Though, It is regarded as one of most stable and stronger coin when compared with the other top coins. From the weekly chart, the price of litecoin is in a sideways movement. Know that we have sideways market that is tradable and sideways market that is not tradable. A tradable sideways market is a ranging market where the resistance and the support are evenly apart.
A sideways market that is not tradable is the weekly chart before us. The market has a choppy price action where the resistance and support levels are very close; therefore trading and profit taking becomes impossible.
LTCUSD Short-term Trend: Bullish

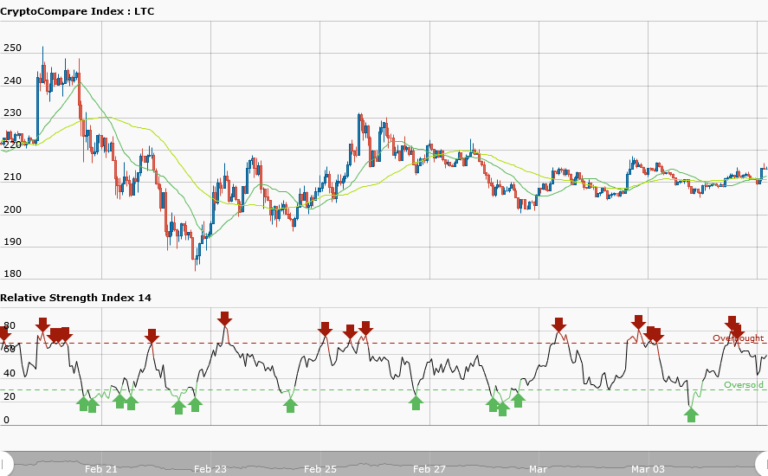
The short term trend has a bullish outlook because the moving averages are below the candlesticks. Today, litecoin has a bullish price spike that made the price to soar to $216. The RSI period 14 is level 56 indicates that the average gains are higher than average losses.


