

LTCUSD Medium-term Trend: Bearish
Resistance: $125, $120, $115
Support: $95, $100, $105
Price of Litecoin is presently trading at $111.80 as at the time of writing. From the weekly chart, it has reached the low of $100 since December, 2017. The support level at $100 is a strong key level which has been tested thrice without any breakdown. The level had been tested in December 2017 and twice in February without any breakdown. Price of Litecoin may get stalled at that level and reversed.
Meanwhile, the RSI period 14 is level 40 which indicates that price is in the range bound zone.If price is in the range bound zone then there is the possibility of a breakout.Price may break the bearish trend line and candlestick closed on the opposite of it to signal the end of the downtrend. On the other hand, it may break the support level to resume the downtrend.
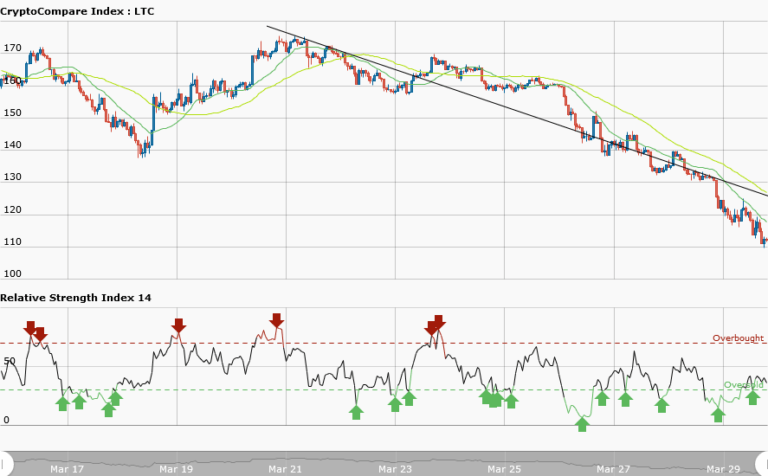
LTCUSD Short-term Trend: Bearish

In the daily chart, price of Litecoin has gotten stalled at the support level of $110 because the previous low of $100 is a strong support. Price is presently ranging towards the bearish trend line for a possible breakout in the future. Meanwhile, the RSI period 14 is level 49 which indicates that price is in the range bound zone.
The views and opinions expressed here do not reflect that of CryptoGlobe.com and do not constitute financial advice. Always do your own research


