

LTCUSD Medium-term Trend: Bearish
Resistance: $150, $145, $140
Support: $120, $125, $130
On March 27th, 2018, price of Litecoin was in a range bound movement oscillating between the resistance at $170 and the support at $140.The assumption was that if there was a breakout at the support level of $140, traders should place short trades and that if price rebounded at the support level they should place long trades. Price actually broke the support level which resulted in the bearish outlook.
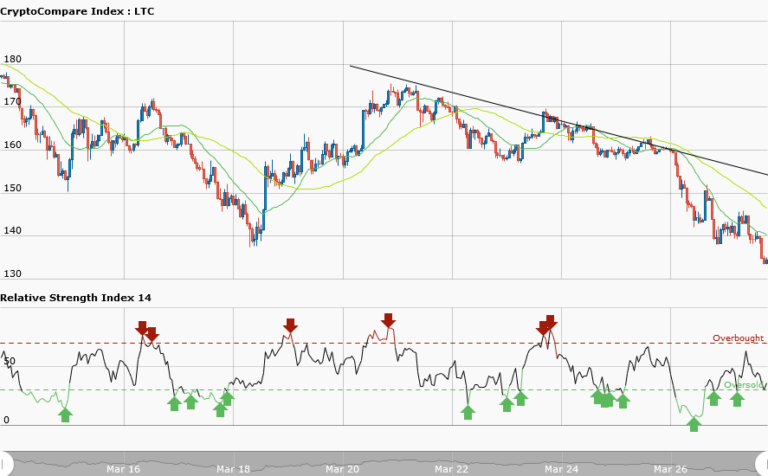
Today, Litecoin is in a bearish outlook trading at $134.47. Price of Litecoin is in a downtrend with a bearish trend line drawn across the price bars. As the downtrend progresses traders should look out for sell setups. These sell setups can be found as soon as price retraces and pulls back; a resistance level would be created where you will have the opportunity to short your trade.
Meanwhile, the RSI period 14 is level 35 which indicates that the market is oversold suggesting bulls taking over the market.
LTCUSD Short-term Trend: Ranging

In the daily chart , price of Litecoin is in a range bound movement. Price is fluctuating from the resistance at $145 and the support at $135. The chart has a choppy price action which is not tradable. Meanwhile, the RSI period 14 is level 52 which indicates that price is in the range bound zone.
The views and opinions expressed here do not reflect that of CryptoGlobe.com and do not constitute financial advice. Always do your own research


