

LTCUSD Medium-term Trend: Ranging
Resistance: $164, $162, $160
Support: $152, $154, $156
Last week Litecoin had been in a range bound movement most of the time but had a bullish trend last Tuesday and Wednesday. It started with a trading price on Monday 19, with $155.29 which soared to $170.89 ,on Wednesday 21. The bulls could not sustain the price at $170.89 to push it further but lost control to the bears who took it to its previous low of $158.64. Today, Litecoin is a range bound movement trading at $156.95.
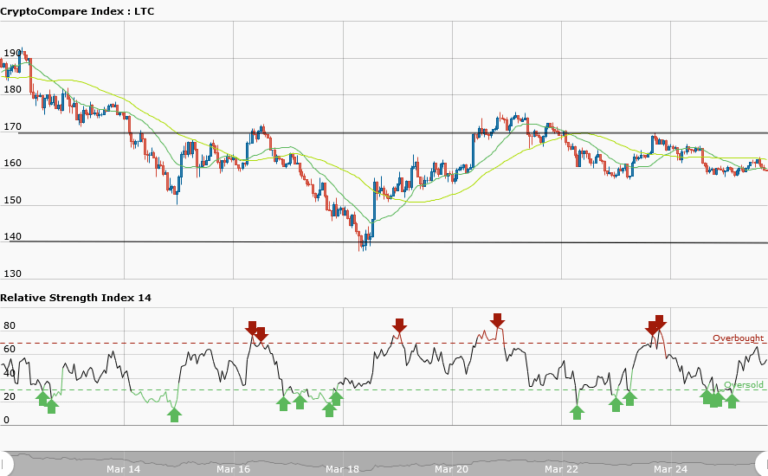
From the weekly chart,the price of Litecoin had been fluctuating between the resistance at $170 and the support at $140 since last week Friday. The price is ranging horizontally which makes the resistance and support not evenly apart in terms of trading. Meanwhile, the RSI period 14 is level 57 which indicates that the price is in range bound zone.
LTCUSD Short-term Trend: Ranging

The daily chart shows Litecoin in a ranging market. The price is oscillating between the resistance at $163 and support at $158. The price action is also choppy. That is, price is not evenly apart between the resistance and support. Meanwhile, the RSI period 14 is level 30 which indicates that the market is oversold.
The views and opinions expressed here do not reflect that of CryptoGlobe.com and do not constitute financial advice. Always do your own research


