

LTCUSD Medium-term Trend: Ranging
Resistance: $176, $174, $172
Support: $164, $166, $168
Litecoin Price Key Highlights:
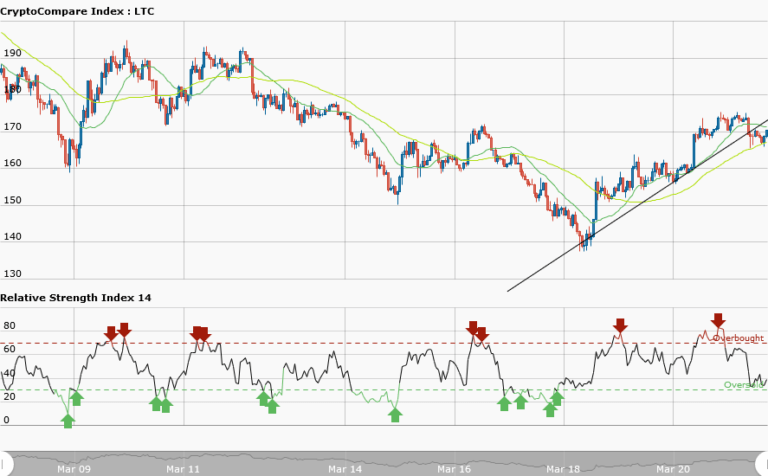
- Litecoin price has broken the bullish trend line.
- Price in a range bound movement.
- Technical indicator price analysis
Yesterday, the price of Litecoin was in a bullish market but today trading at $170.38. From the weekly chart, the price of Litecoin has broken the bullish trend line and candlestick closed on the opposite of the trend line. The effect of this breakout is that the current trend has come to an end. The price is currently oscillating between the resistance at $174 and the support at $166.
Now in the weekly chart, the RSI period 14 is level 33 which indicates that the market is oversold suggesting bulls taking over the market. If the bulls break the resistance level traders should place long orders. Also, in the daily chart the RSI period 14 is level 73 which indicates that the market is overbought suggesting bears to take control of the market.
However, if the bears break the support level, traders should take short trades.
LTCUSD Short-term Trend: Ranging

In the short term trend, we have the daily chart of Litecoin in a range bound movement. The price of Litecoin is not evenly apart between the resistance and support levels.


