

LTCUSD Medium-term Trend: Bullish
Resistance: $190, $185, $180
Support: $155, $160, $165
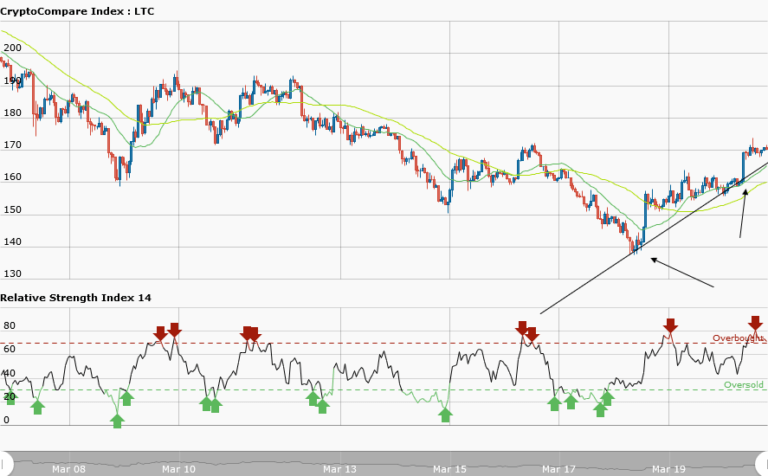
The price of Litecoin is in a bullish market and trading at $170.89 as at the time of my writing. LTCUSD pair is in an uptrend where the price is making higher highs and higher lows. From the weekly and daily charts we have the following conclusions: Firstly, place your long trades at the support areas as designated by the arrows on the bullish trend line.
Secondly, in the absence of a trend line watch out for price retracement or downward corrections where you can place long trades as the price pulls back. Thirdly, put a stop loss of 100 pips below the support level because of the volatility of the market. Fourthly, the RSI period 14 is level 73 which indicates that the market is overbought suggesting bears taking over the market. In view of this all bullish orders should be exited.
Fifthly, you exit all your bullish orders as soon as the price breaks the trend line and the candlestick closed on the opposite of the trend line.
LTCUSD Short-term Trend: Bullish

In the short term trend, we have the daily chart of Litecoin in an uptrend with a bullish trend line showing support levels of price. Meanwhile, the RSI period 14 is level 53 which indicates that average gains are higher than average losses


