

LTCUSD Medium-term Trend: Bullish
Resistance: $216, $214, $212
Support: $204, $206,$208
The LTCUSD pair is trading in a bullish market as it was yesterday. Today the pair is in a smooth uptrend trading at $210.37.The daily chart shows a smooth uptrend with the trend lines showing support levels. An uptrend is present when prices make a series of higher highs (HH) and higher lows (HL). We can trade the uptrend by using the tools available to us.
First you can follow the familiar logic of buying low or selling high. Secondly, in an uptrend, if a currency pair retraces from its recent high, it’ll create a support level. Traders who wish to go long can enter a position when price pulls back to its support level. Thirdly, if the trend does not continue, you can exit your position. On the other hand, if the trend does continue, you could profit several times the amount you initially risk to enter the trade.
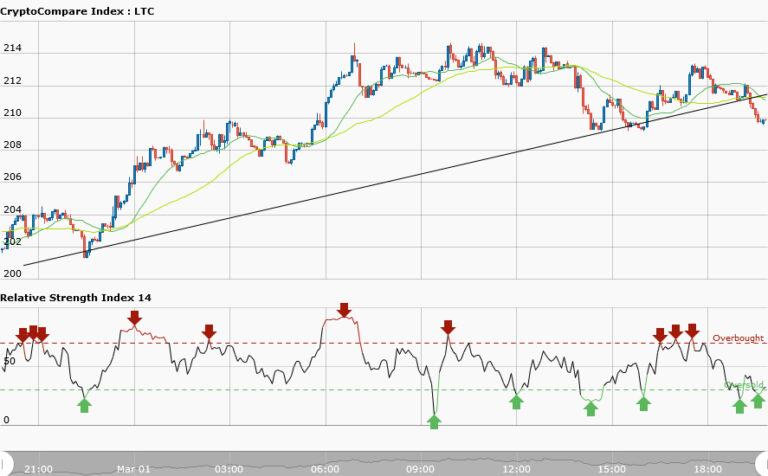
LTCUSD Short-term Trend: Bearish

The short term trend is a bearish market, the daily chart showing trend lines with resistance level where you can short. The RSI period 14 is level 79 indicates that the market is overbought. The RSI indicator gives a strong signal that reversal in price is imminent.


