

LTCUSD Medium-term Trend: Ranging
Resistance: $178, $177, $176
Support: $172, $173, $174
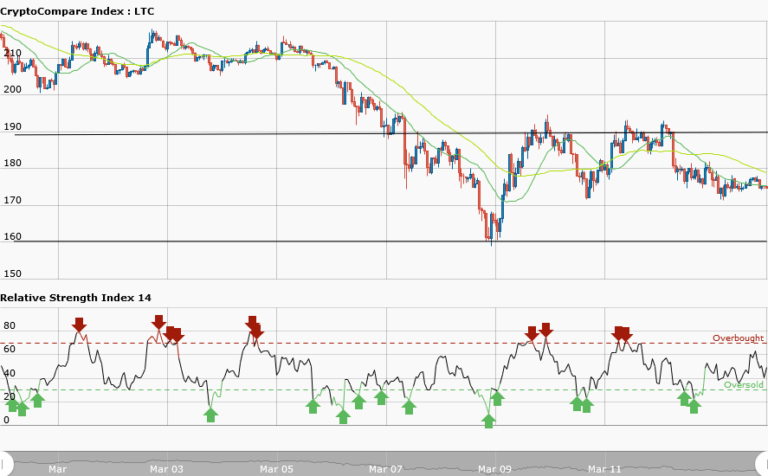
Today, LTCUSD pair is moving in a sideways trend. This is the sixth day after the selloff that the pair is still respecting the key levels of resistance at $190 and the support at $160. If the price breaks the resistance level of $190 it will rise to its previous level of $210. On the other hand, if it breaks the support level, the price will fall to as low as $150. From the weekly chart, Litecoin has a choppy price action.
The market is currently moving horizontally, therefore trading becomes impossible.Trading becomes possible when the market is either bullish, bearish or ranging. Meanwhile, the RSI period 14 is level 49 which indicates that price is in the sideways trend zone.
LTCUSD Short-term Trend: Ranging

In the short term trend, the daily chart shows the pair having a choppy price action. Do not trade in the short term trend because of the price action. Meanwhile, the 50-day moving average and the 20-day moving average are trending sideways whereas the RSI period 14 is level 44 which indicates that the price is in the sideways trend zone.


