

LTCUSD Medium-term Trend: Sideways
Resistance: $195, $190, $185
Support: $165, $170, $175
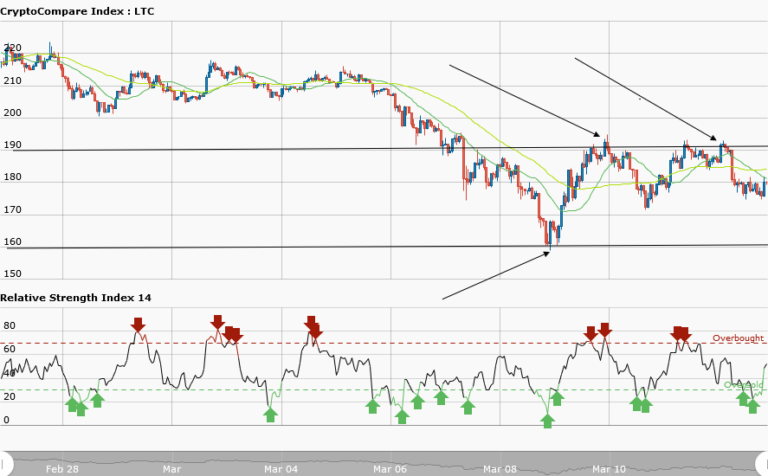
Yesterday, March 12, LTCUSD pair was moving in a sideways (ranging) trend. The price was oscillating between the support at $160 and the resistance at $190.The sideways trend continues today with price falling to $173.65 as at the time of writing. You may wish to trade the sideways trend since the price is ranging. If the price didn’t break the support level place a long trade and exit near the support zone.
Similarly, at the resistance level take a short trade and exit near the support zone.However, the RSI period 14 is level 48 which indicates that price is in the sideways trend zone.
LTCUSD Short-term Trend: Sideways

Yesterday, Litecoin was in a bullish trend showing the support levels on a bullish trend line. The support levels were buy setups where a trader could place a long trade. However, the bullish trend was broken and price fell to a sideways movement. The price is currently oscillating between $180 and $175 and moving horizontally. There is need to suspend trading until we see a bullish, bearish or a ranging market.
Meanwhile, the RSI period 14 is level 51 which indicates that average gains are higher than average losses.


