

LTCUSD Medium-term Trend: Ranging
Resistance: $205, $200, $195
Support: $175, $180, $185
Last week Monday and Tuesday, litecoin had been in a sideways movement trading at $213.82. However, it was under the control of the bears on Wednesday, Thursday, and Friday trading at $160. In the other words, a decline in price of about 25% which was due to selloff on cryptocurrencies.
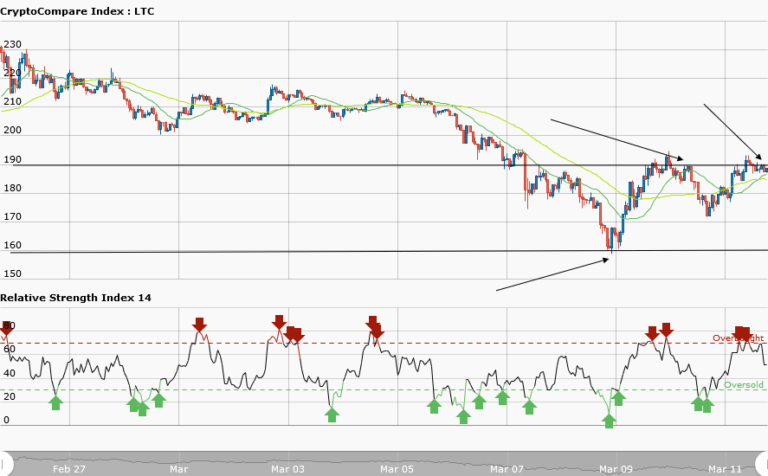
Litecoin is currently trading at $188.49. From the weekly chart, LTCUSD pair is moving in a sideways (ranging) market. The price at $160 is the support where the price got stalled last Friday. Whereas the price at $190 is the resistance level. If you have followed the sideways trend from its inception last Friday, then you are expected to place a short trade at the resistance and exit near the support zone.
Also, take a long trade at the support and exit near the resistance zone .The orders should match the numbers of arrows. However, the RSI period 14 is level 51 which indicates that average gains are higher than average losses.
LTCUSD Short-term Trend: Bullish

In the short term trend, LTCUSD pair is in a bullish market showing the support levels where you can place long trades. When price touches the trend line a buy setup is established but if it breaks the trend line then the bullish trend will come to an end. The RSI period 14 is level 63 which indicates that the price is in the bullish trend zone.


