

LTCUSD Medium-term Trend: Bullish
Resistance: $225, $220, $215
Support: $195, $200, $205
In the medium term trend, LTCUSD pair is trading at S208.18 and has a bullish outlook because the moving averages are below the candlesticks on March 1. The 50-day moving average and 20-day moving average are trending northward whereas the RSI period 14 is level 73 indicating that the market is overbought.In a bullish market, an uptrend is present where prices make series of higher highs (HH) and higher lows (HL).
Traders can follow the familiar logic of buying low and selling high. Secondly, in an uptrend if a currency retraces from the recent high it will create support level. Traders who wish to go long can take a long position when the price pulls back to its support level.
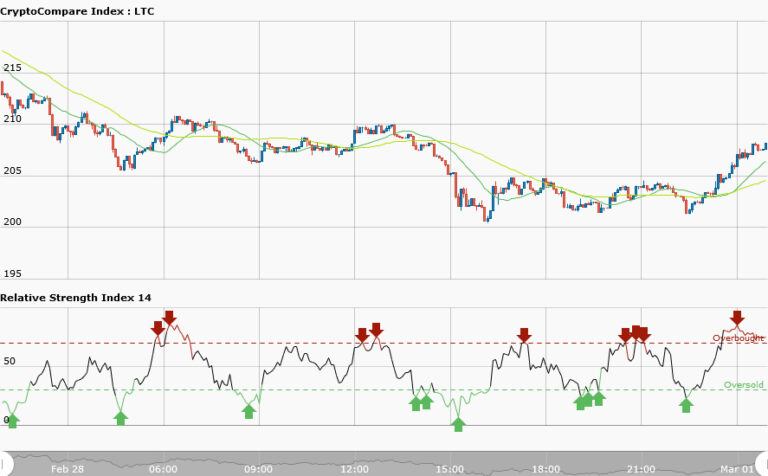
LTCUSD Short-term Trend: Bullish

In the short term trend the market is bullish. The 50-day moving average and 20-day moving average are trending northwards whereas RSI period 14 is level 73 indicating that the market is overbought suggesting that the bears should take control of the market. If the price does not rally then traders can take a long position.


