
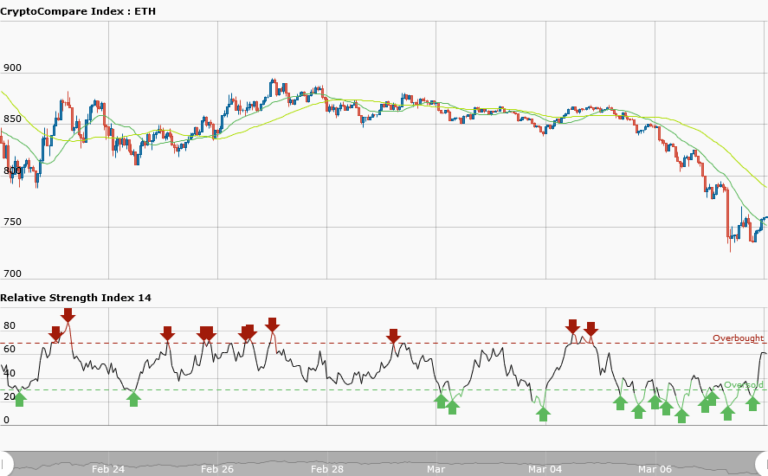

ETHUSD Medium-termTrend: Bearish
Resistance: $790, $780, $770
Support: $730, $740, $750
Yesterday, March 7, I said Ethereum price might continue to rally downward until it gets to the support level of $750. On the other hand if it rose it would encounter resistance at $800 and if that level was broken then the price would soar higher. But if the price of Ethereum fell the market would be breached. It is currently trading at $761.23.The fact is that Ethereum price fell to its low at $730 because it encounters resistance at $800 yesterday.
The price of Ethereum may likely rise today because it has reached its low of the support level. Traders can take a long position at the early stage of the bullish trend. However, 50-day moving average and 20-day moving are trending southward whereas the RSI period 14 is level 61 indicates that the market is in the bullish trend zone.
ETHUSD Short-term trend: Sideways

In the short term trend, the price of Ethereum fell from $790 to as low as $730 yesterday and commenced a sideways movement. The price is oscillating between the level of $760 as the resistance level and $740 as the support level. Do not trade a sideways market because of the choppy price action. But if you must trade you place a short order at the resistance level and exit near the support zone.
Also you place a long order according to the number of arrows and exit near the resistance zone.


