

ETHUSD Medium-term Trend: Sideways
Resistance: $1000, $950, $700
Support: $700, $750, $800
Last week, ethereum has been trading sideways most at times. Unlike, bitcoin the price has been fluctuating between $820 and $880 since a week ago; but currently trading at $864.04. From the weekly chart, ethereum is in a sideways market and it is possible this sideways movement may continue this week as per the price action. Trading in a sideways market is unnecessary because of choppy price action.
Meanwhile, 50-day moving average and 20-day moving are trending sideways whereas the RSI period 14 is level 62 indicates that price is in the bullish trend zone.
ETHUSD Short-term trend: Sideways

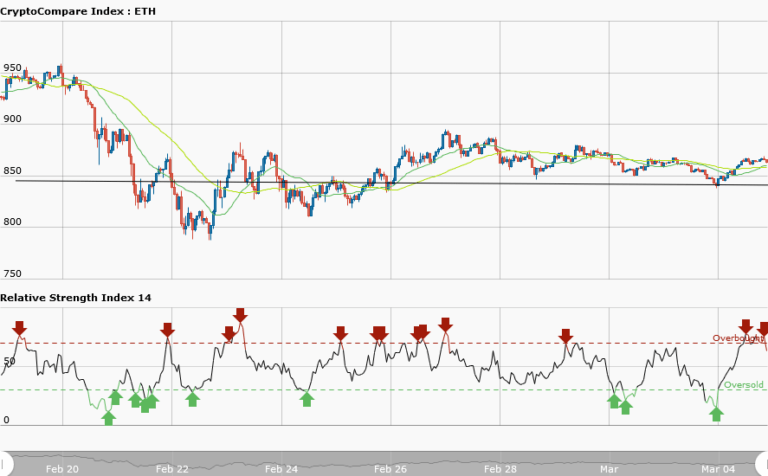
In the daily chart, ETHUSD pair was in a bullish trend before it commenced its sideways movement. The bullish trend of ethereum ended at a price of $865 when it commenced a sideways movement. At this point the resistance and support levels are not evenly apart because of the choppy price action. Trading in this market will likely result in loss of capital.
The 50-day moving average and 20-day moving are trending sideways whereas the RSI period 14 is level 61 indicates that price is in the bullish trend zone.


