

ETHUSD Medium-term Trend: Bearish
Resistance: $410, $400, $390
Support: $350, $360, $370
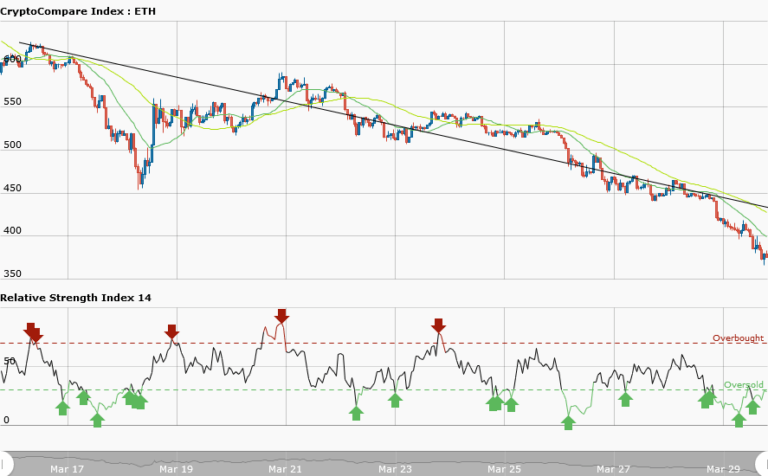
Price of Ethereum has fallen below the previous low of $400 since November, 2017. It is presently trading at $377.03. Meanwhile, the RSI period 14 is level 29 which indicates that the market is oversold suggesting bulls taking control of the market.The market is actually oversold and traders should look for buy setups. For now the price will be consolidating at this level before a possible breakout.
After price consolidation, it is expected to break the bearish trend line which will signal the end of the downtrend.
ETHUSD Short-term trend: Bearish

If price of Ethereum breaks the trend line,this signals the end of the downtrend. However, if it is a price retracement; then price will pull back to resume its downward movement. Meanwhile, the RSI period 14 is level 58 which indicates that price is in the range bound zone.
The views and opinions expressed here do not reflect that of CryptoGlobe.com and do not constitute financial advice. Always do your own research.


