

ETHUSD Medium-term Trend: Ranging
Resistance: $540, $530, $520
Support: $480, $490, $500
Ethereum Price Key Highlights:
- Ethereum previous price level of $600.
- Price in a range bound movement.
- Technical indicator price analysis.
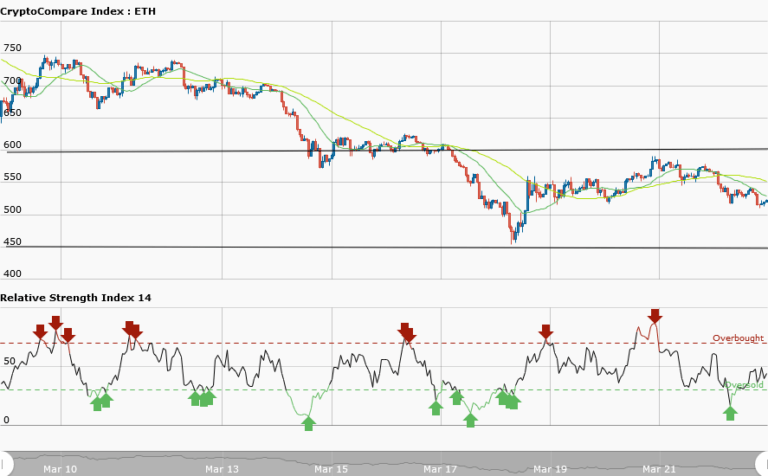
Yesterday, Ethereum was in a ranging market and the RSI period 14 indicated that the market was oversold suggested bulls taking over the control of the market. Yesterday, it was trading at $566.16 and the bulls could not break the resistance level at $600 to take the price further. The bulls succumbed to the bears and the price fell to as low as $515.45.
However, from the weekly chart the price of Ethereum will be oscillating between the resistance at $600 and the support at $450 for now. Trading is not advisable because of the ranging market. The range bound movement will produce a breakout either from the bulls or the bears. Meanwhile, the RSI period 14 is level 44 which indicates that the price is in the range bound zone.
ETHUSD Short-term trend: Bearish

In the short term trend, the price of Ethereum is in a bearish outlook. The 50-day moving average and 20-day moving average are trending southward. The RSI period 14 is level 34 which indicates that the market is oversold suggesting bulls taking control of the market. Traders should look for buy setup.


