

ETHUSD Medium-term Trend: Ranging
Resistance: $590, $580, $570
Support: $520, $530, $540
Ethereum Price Key Highlights:
- Ethereum price has broken the bullish trend line
- Price in a range bound movement.
- Technical indicator price analysis.
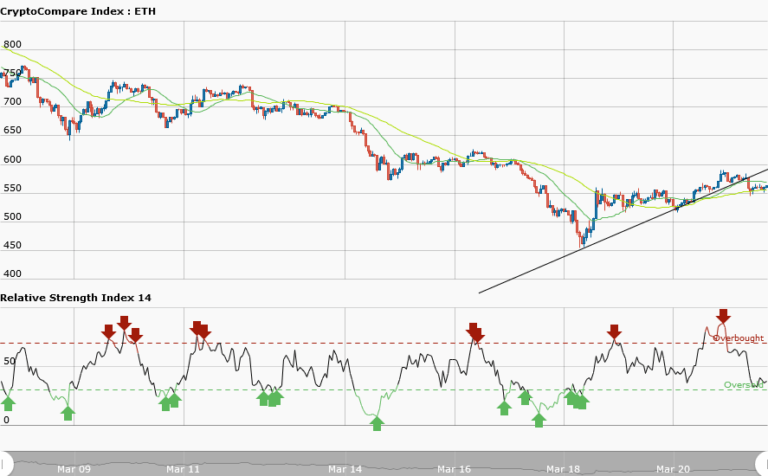
Yesterday, Ethereum was in a bullish market trading at $566.16. From the weekly chart the price of Ethereum has broken the bullish trend line and the candlestick closed on the opposite of the trend line.
The implication of this is that the current bullish trend has ended. The price is now in a range bound movement. The price is neither under the control of the bulls nor the bears. Now in the medium short term, the RSI period 14 is level 35 which indicates that the market is oversold suggesting that bulls will take control of the market.
Presently the price is ranging between $540 and $580 and if the bulls breaks the resistance level of $590; it will revisit its previous high of $650.Similarly, in the short term trend, the RSI period 14 is level 77 which indicates that the market is overbought suggesting that bears will take over the market. This implies that if the bears break the support level of price then price will fall to its previous low.
ETHUSD Short-term trend: Ranging

In the short term trend, we have the price of Ethereum in a range bound market. Ethereum is oscillating between the resistance at $590 and the support at $560.


