

ETHUSD Medium-term Trend: Bullish
Resistance: $590, $580, $570
Support: $530, $540, $550
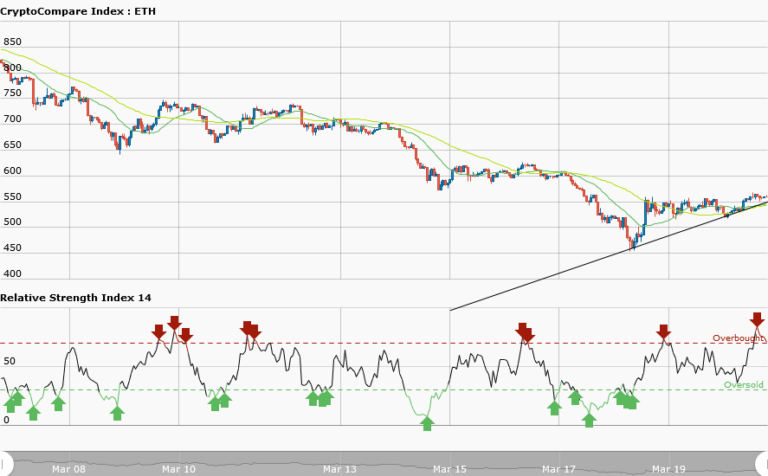
ETHUSD pair is in a bullish market and trading at $564.50. Ethereum is making higher highs and higher lows. From the weekly and daily charts a trend line is drawn to extract the following deductions:
Firstly, place long orders at support areas as designated by the arrows. Secondly, in the absence of a trend line watch out for price retracement or downward corrections to place your long trades as the price pulls back. Thirdly, you put a stop loss of 100 pips below the support level because of the volatility of the market.
Fourthly, the RSI period 14 is level 75 which indicates that the market is overbought suggesting bears taking over the control of the market. In that case all bullish orders should be exited. Fifthly, when the price breaks the trend line in the course of the bull market and the candlestick closed on the opposite of the trend line, then you can exit you trades. However, the resistance level may be breached if the bullish market continues.
ETHUSD Short-term trend: Bullish

In the short term trend, we have the price of Ethereum in an uptrend with a bullish trend line showing the support levels of price. Meanwhile, the RSI period 14 is level 60 which indicates that price is in the bullish trend zone.


