

ETHUSD Medium-term Trend: Ranging
Resistance: $625, $620, $615
Support: $595, $600, $605
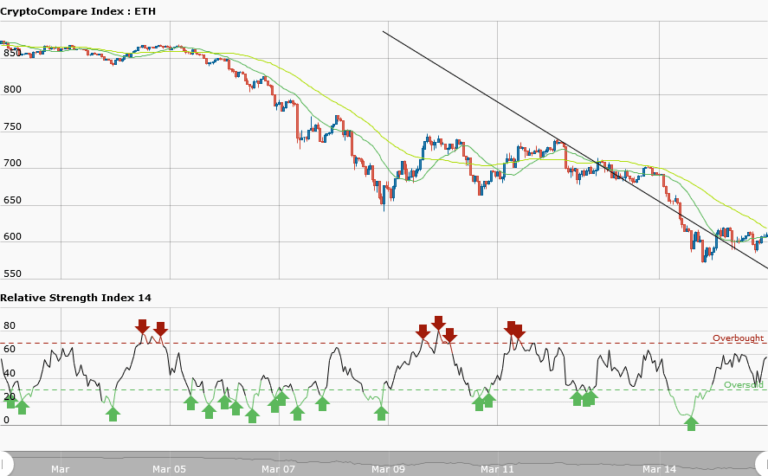
Yesterday, March 15, ETHUSD pair broke the support level of $650 and fell to a low of $582.85. Also, the RSI period 14 is level 28 indicated that the market was oversold suggesting bulls taking over the market. Bearish traders were advised to exit their positions because of the oversold market condition. Today, from the weekly chart, Ethereum price has broken the bearish trend line which signaled the end of the downtrend to a range bound market.
There was a retracement of price from the low which broke the trend line and commence a range bound movement. It is currently trading at $609.88 and trying to consolidate itself at the support level of $600. Meanwhile, the RSI period 14 is level 56 which means that the average gains are higher than average losses.
ETHUSD Short-term trend: Ranging

Yesterday, Ethereum was in a smooth downtrend but the RSI period 14 indicated that the market was oversold suggesting bulls taking over the market. From the daily chart, Ethereum is now in range bound market oscillating between the resistance at $615 and support at $590. The daily chart has a choppy price action and as such not tradable. However, the RSI period 14 is level 45 which means price is in the range market zone.


