

ETHUSD Medium-term Trend: Bearish
Resistance: $640, $620, $600
Support: $520, $540, $560
ETHUSD pair has been fluctuating between the key levels of resistance at $750 and support at $650. It was assumed that if the price breaks the resistance level it would rise to retest another resistance at $800 but if it breaks the support level it will fall to as low as $600. Today, Ethereum price has broken the support level and it is now trading at $582.85 as at the time of writing.
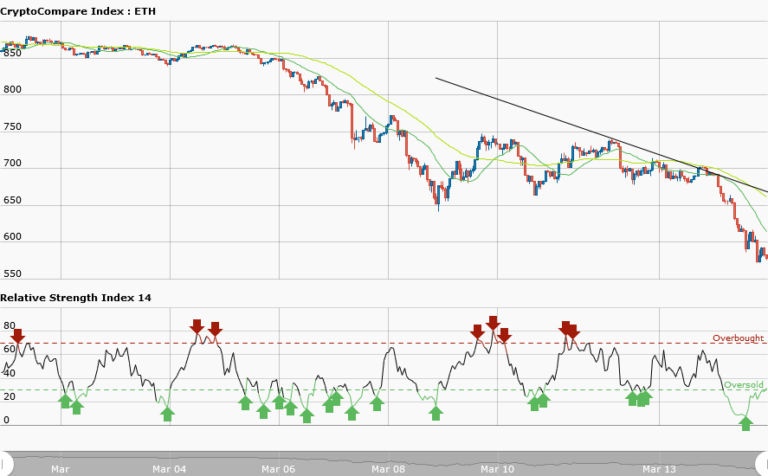
From the weekly chart you will find a bearish trend line showing resistance levels where a trader can place short trades. A trader should take note that if the price retrace from the low and test the bearish trend line a resistance level will be created for a trader to take a short trade. Similarly, if the price breaks the trend line the bearish outlook will come to an end.
However, the RSI period 14 is level 28 which indicates that the market is oversold suggesting bulls taking over the market. Bearish traders should be ready to exit their current position.
ETHUSD Short-term trend: Bearish

In the short term trend, the daily chart shows Ethereum in a smooth downtrend. In a downtrend, if prices retrace from the recent low, a resistance level would be created. This gives traders the opportunity to short. You can also exit your position if the trend does not continue. However, the RSI period 14 is level 30 which indicates that the market is oversold suggesting bulls taking over the market.


