

ETHUSD Medium-term Trend: Sideways
Resistance: $740, $730, $720
Support: $680, $690, $700
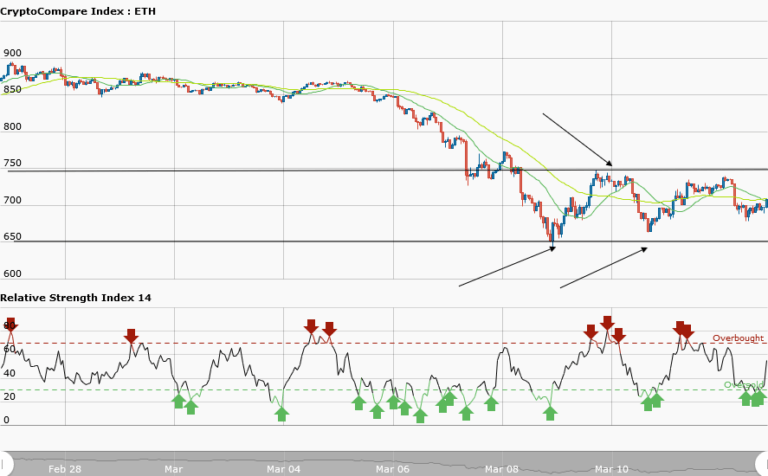
Yesterday, March 12, ETHUSD pair was moving in a sideways (ranging) trend. The price was oscillating between the support at $650 and the resistance at $750. The sideways trend continues today with Ethereum trading at $709.33 as at the time of writing. Since the price is fluctuating between the key levels you may wish to continue to trade the sideways trend.
The price of Ethereum is falling and rising at the same time. If the price gets to the support level, place a long trade and exit near the resistance zone. At the resistance level if there is no breakout but a falling price then take a short trade and exit near the support zone.
Meanwhile, the RSI period 14 is level 54 which indicates that the average gains are higher than the average losses.
ETHUSD Short-term trend: Sideways

Yesterday, ETHUSD pair was in a bullish trend and a bullish trend line was drawn showing the support levels where a trader could place a long trade. And I said that if the bullish trend line was broken that would end the bullish trend. The bullish trend was actually broken which leads to a sideways trend today. You can see the daily chart showing price moving horizontally at $700 and $690 after the breakout.
Meanwhile, the RSI period 14 is level 82 which indicates that the market is overbought suggesting bears taking over of the market.


