

ETHUSD Medium-term Trend: Sideways
Resistance: $750, $740, $730
Support: $690, $700, $710
Last week Monday and Tuesday, ethereum was in a sideways market trading between $852.62 and $864.04; while on Wednesday, Thursday, and Friday it was under the control of the bears pushing the price to as low as $640. In the other words, there was a price decline of 25.9%. This was caused by unauthorized selloff on cryptocurrencies. However, ethereum is trading at $724.53 as at the time of trading.
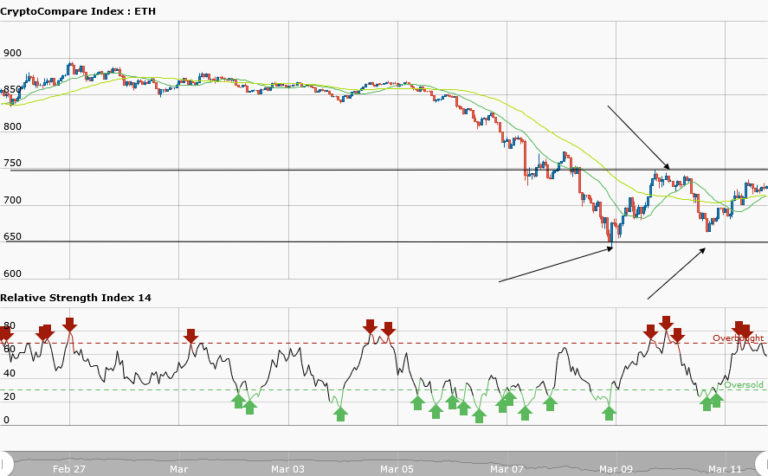
From the weekly chart, ETHUSD pair is moving in a sideways (ranging) market. The price at $650 is the support where the price got stalled last Friday. Whereas the price at $750 is the resistance level. If you have followed the sideways trend from its inception last Friday, then you are expected to place a short trade at the resistance and exit near the support zone.
Also, place a long trade at the support and exit near the resistance zone. The orders should match the numbers of arrows. However, the RSI period 14 is level 60 which indicates that price is in the bullish trend zone.
ETHUSD Short-term trend: Bullish

In the short term trend, ETHUSD pair is in a bullish market showing the support levels where you can place long trades. The RSI period 14 is level 32 which indicates that the market is oversold suggesting bulls taking over the market. The price action diverges with RSI indicator while prices are rising RSI indicator is falling; which means reversal in price is imminent.


