

ETHUSD Medium-term Trend: Sideways
Resistance: $885, $880, $875
Support: $855, $860, $865
ETHUSD pair is still in a sideways market as the case was yesterday. Presently, it is trading at $868.14. Yesterday, the pair was oscillating between the resistance of $885 and the support level of $870. Unfortunately, price broke our support level of $870 and this level is now our resistance. In other words, price is oscillating between the resistance level of $870 and our new support level of $855.
If the price gets to the level of $855 traders can take a long position and exit near the resistance zone. On the other hand if the price gets to the level of $870 traders can take a short position and exit near the support zone. If the price breaches the support level then traders should take a short position and exit by trail stopping your profit.
In the same vein, if the bulls take control and there is break out at the resistance level traders should take a long position and exit by trail stopping your profits.
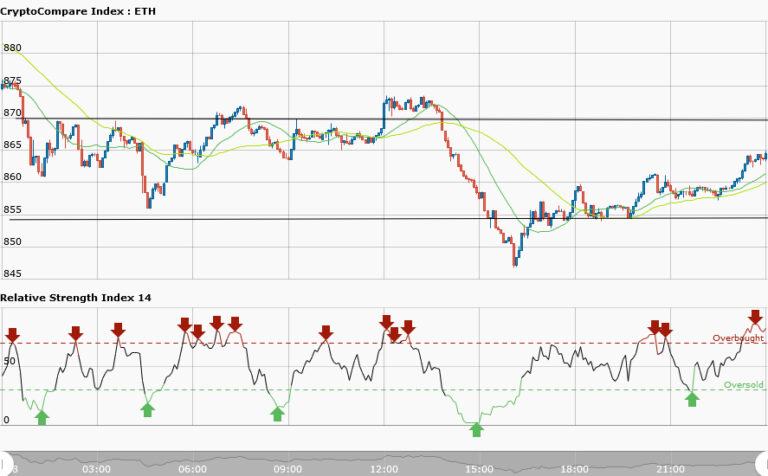
ETHUSD Short-term trend: Bullish

The short term trend is bullish because the moving averages are below the candlesticks. The RSI period 14 is level 17 indicates that the market is oversold.The RSI indicator diverges with price trend, whereas we have an upper trend the RSI indicator shows that the market is oversold. This gives us a strong signal that reversal in price is imminent.


