

BTCUSD Medium-term Trend: Bearish
Resistance: $9,600, $9,400, $9,200
Support: $8,400, $8,600, $8,800
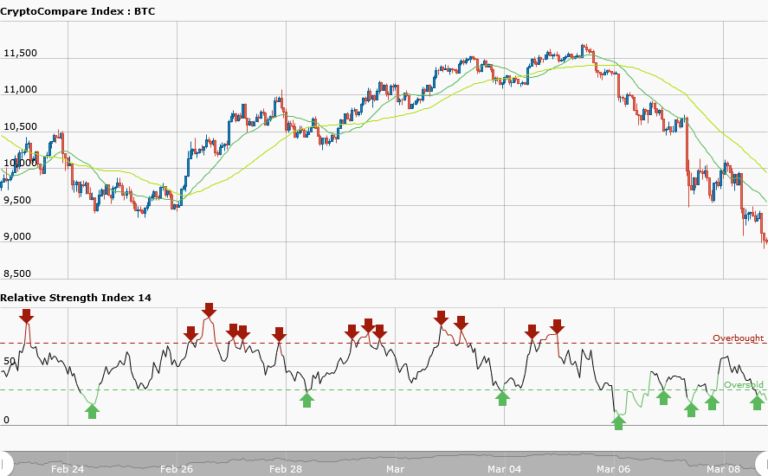
Yesterday, March 8, Bitcoin price has fallen to its low at $9,600 and since it is at the support level traders ought to place long order so as to catch the bullish trend at its early stage. Rather the price went beyond $9000 as against its February lows .
There are reports of negative news that fuel the sell off .The news had it that investors were angry at the trustee of the collapsed Japanese bitcoin exchange Mt Gox Nobuaki Kobayashi dumping $400 million-worth of bitcoin and bitcoin cash. . It was assumed that the selloff has ended.
The RSI period 14 is level 25 indicates that the market is oversold suggesting bulls taking over the market. The price action shows the market is consolidating on the daily chart ,that is a pause on the bearish move and a possible breakout. Traders should expect long orders because the market is oversold.
BTCUSD Short-term Trend: Bearish

In the short term trend, the price was in a sideways movement before it fell again. Presently, the price has fallen to the level of $8500 now appreciating upwards. However, the RSI period 14 is level 51 which indicates that average gains are higher than average losses.


