

BTCUSD Medium-term Trend:Bullish
Resistance: $11,900, $11,800, $11,700
Support: $11,300, $11,400, $11,500
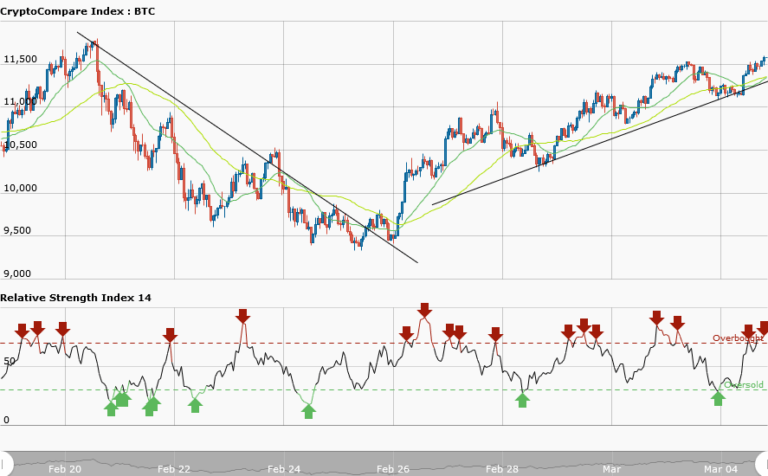
Bitcoin has been bullish since last Tuesday, Wednesday, Thursday, and Friday with a trading price of $10,344.44 to $11,147.87 .Today, it is presently trading at $11,585.07 as at the time of writing.From the weekly chart, you can see a bearish trend line of Last week. On February 26, the bearish trend line was broken to give birth to the current bullish trend.
The bullish trend line also shows the support level where the price has pulled backs. Traders who wish to go long can enter a position when price pulls back to its support level. Also note that if the trend does not continue, you can exit your position. On the other hand, if the trend does continue, you could profit several times the amount you initially risk to enter the trade.
Meanwhile, 50-day moving average and 20 day moving are trending northward whereas the RSI period 14 is level 72 indicates that the market is overbought suggesting bears taking control of the market.
BTCUSD Short-term Trend: Bullish

In the short term trend, the Daily chart has a bullish outlook because the moving averages are below the candlesticks. The RSI period14 is level 80 indicates that the market is overbought suggesting bears takeover of the market.


