

BTCUSD Medium-term Trend: Bearish
Resistance: $7,600, $7,400, $7,200
Support: $6,400, $6,600, $6,800
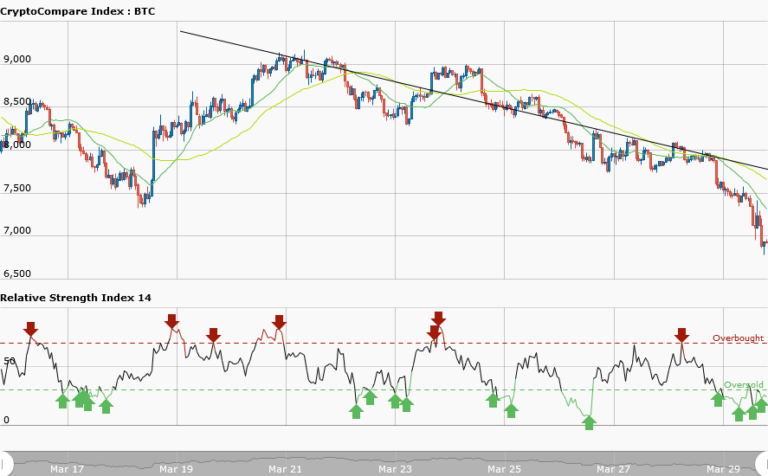
Price of Bitcoin has fallen again in the last 24 hours breaking the critical level of $7,500. From the weekly chart, we may experience the lows of $5,947 in February 6, 2018, as the price depreciates further. Presently, it is trading at $6,700.68. However, the selling pressure has not abated therefore traders should also focus to spot the resistance levels to short their trades.
As you already know resistance levels are points where price retraces and later pulls back. Meanwhile, the RSI period 14 is level 22 which indicates that the market is oversold suggesting bulls taking control of the market. Although, the market is oversold price may rally for sometimes but traders should exit as soon the downtrend ends.The downtrend will end if price breaks the bearish trend line.
BTCUSD Short-term Trend: Bearish

Price of Bitcoin is in a smooth downtrend. From the daily chart, price of Bitcoin is consolidating at $6800 and at the same time retracing. If it is an indication of a reversal in price then it must break the bearish trend line. But if it is a retracement then price will pull back and resume its downtrend. However, the RSI period 14 is level 58 which indicates that price is in the range bound zone.
The views and opinions expressed here do not reflect that of CryptoGlobe.com and do not constitute financial advice. Always do your own research.


