

BTCUSD Medium-term Trend: Bearish
Resistance: $7,900, $7,800, $7,700
Support: $7,300, $7,400, $7,500
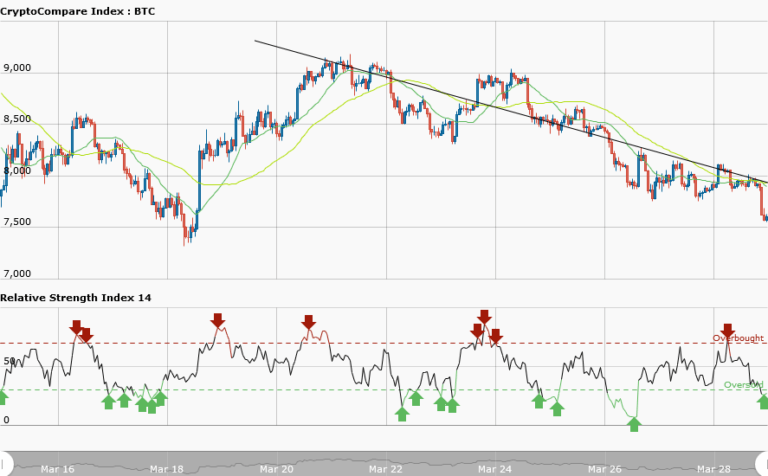
The critical levels of price of Bitcoin: the resistance level at $9,000 and the support level at $7,500 are yet to be broken since March17th, 2018. The price is presently trading at $7540.30. Price decline has been illustrated with a bearish trend line which runs across the price bars showing the resistance levels of price. The moving averages also confirm price decline.
As a result of present price decline, the support levels of Bitcoin may be broken. If the support level of $7,500 is broken, BTCUSD pair will be weaken further inviting more selling pressure. We may experience our previous lows of $7,300 and $6,075. However, if the support level of $7,500 is broken traders should place short trades.
I don’t see price rebounding and having a bullish outlook at the support level but price may consolidate. Meanwhile, the RSI period 14 is level 25 which indicates that the market is oversold suggesting bulls taking control of the market, briefly.
BTCUSD Short-term Trend: Bearish

In the daily chart, price of Bitcoin has a bearish view. Price was ranging between the resistance at $8,100 and support at $7,900 before it fell to $7,600. However, the RSI period 14 is level 58 which indicates that price is in the range bound zone. If price breaks the support level it may consolidate itself at that level for now.
The views and opinions expressed here do not reflect that of CryptoGlobe.com and do not constitute financial advice. Always do your own research.


