

BTCUSD Medium-term Trend: Ranging
Resistance: $8,700, $8,600, $8,500
Support: $8,100, $8,200, $8,300
Bitcoin Price Key Highlights:
- Bitcoin previous price level of $9,000.
- Price in a range bound movement
- Technical indicator price analysis.
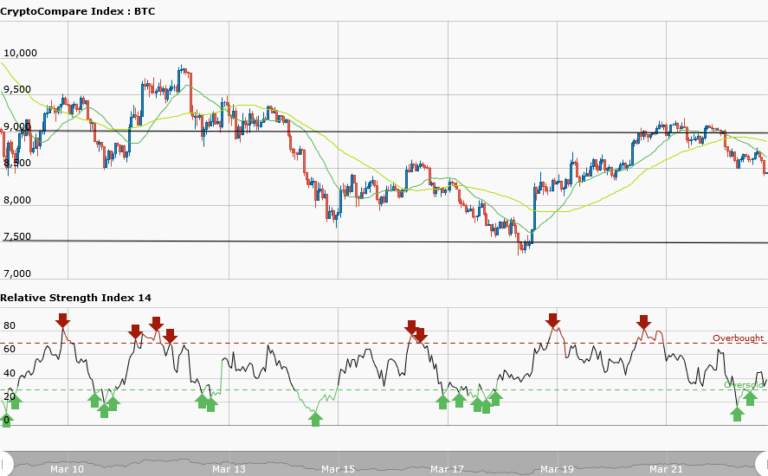
Yesterday, Bitcoin was in a bullish market and the bulls regained control as the price reached its previous level of $9,000.The assumptions yesterday was that if the bulls consolidate or price remained above $9000, there is the tendency of price falling. Instead the bulls should break the resistance level at $9,460 and take the price to $10,500. Presently, Bitcoin is trading at $8,404.36 as at the time of writing.
Today, the price has fallen because the bulls could not sustain the $9,000 resistance level. However, from the weekly chart the price will be oscillating between the resistance level at $9,000 and the support level at $7,500 for now. Meanwhile, the RSI period 14 is level 38 which indicates that the market is nearing the oversold market condition.
BTCUSD Short-term Trend: Bearish

In the short term trend, the price of Bitcoin is in a bearish outlook. However, the 50-day moving average and 20-day moving average are trending southward. The RSI period 14 is level 14 which indicates that the market is oversold suggesting bulls to take control of the market. Traders should look for buy setup.


