
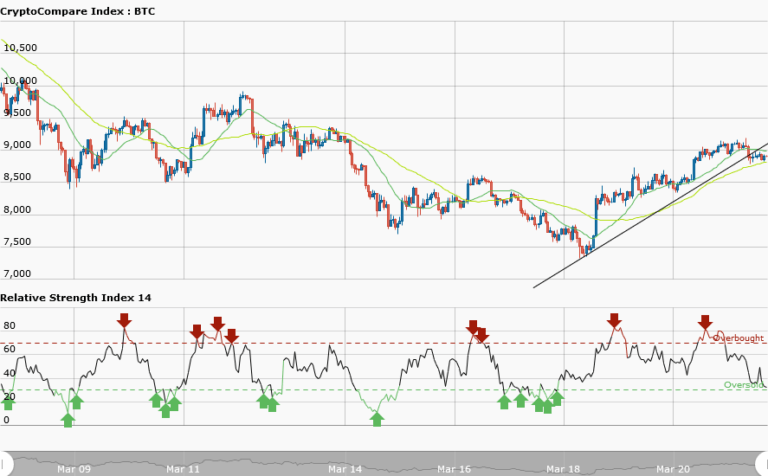

BTCUSD Medium-term Trend: Ranging
Resistance: $9,200, $9,100, $9,000
Support: $8,600, $8,700, $8,800
Bitcoin Price Key Highlights:
- Bitcoin price has broken the bullish trend line.
- Price in a range bound movement.
- Price revisits its previous high.
Yesterday, Bitcoin price was in a bullish market and the bulls regained control for now, though the cryptocurrency is still in a downtrend. Bitcoin is currently trading at $9059.84 and has recovered about 17% from its fall. However, from the weekly chart the price of Bitcoin has broken the bullish trend line to form another trend. The implication is that the bullish trend has ended and a range bound movement commenced.
In a ranging market neither the bulls nor the bears has control of the market. But the RSI period 14 is level 33 which indicates that the market is oversold suggesting bulls taking control of the market. Now if the bulls take control of the market as they have revisited the $9,000 mark is to break the resistance level of $9460 so as to reach the former high of $10,500.
However, if the bulls consolidate or remain at the $9,000 mark there is the tendency of price falling.
BTCUSD Short-term Trend: Ranging

In daily chart, you find the price of Bitcoin in a ranging market. The pattern of the price is so disorderly and it is not advisable to trade such market. However, the RSI period 14 is level 71 which indicates that the market is overbought suggesting bears to take control of the market.


