

BTCUSD Medium-term Trend: Bullish
Resistance: $9,300, $9,200, $9,100
Support: $8,700, $8,800, $8,900
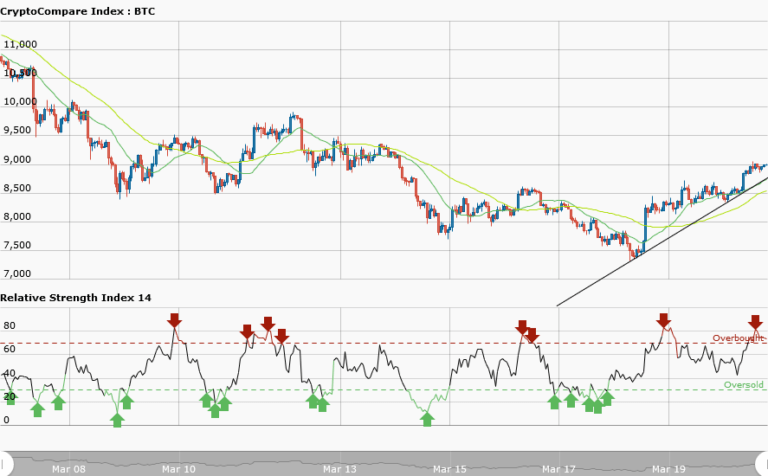
Bitcoin price is in a bullish market trading at $8,973.47 as at the time of writing. The price is in a smooth uptrend as shown in the daily and weekly chart. An uptrend is when price is making higher highs and higher lows. From the weekly and daily charts; a bullish trend line is drawn to enable us execute the following: Firstly, as the uptrend progresses you place long orders at the support areas designated by the arrows on the daily chart.
Secondly, in the absence of a trend line, watch out for price retracement or downward correction to place your long orders as the price pulls back. Thirdly, you put a stop loss of 100 pips below the support level because of the volatility of the market. Fourthly, the RSI period 14 is level 74 which indicates that the market is overbought suggesting that the bears should take control of the market.
That is, all open trades should be exited. Fifthly, when you see the price break the trend line and the candlestick closed on the opposite side of the trend line then you can exit your positions. Today, if the uptrend continues the resistance level may be breached.
BTCUSD Short-term Trend: Bullish

In the daily chart, you will find price of Bitcoin in an uptrend with a bullish trend line showing the support levels designated with arrows. However, the RSI period 14 is level 78 which indicates that the market is overbought suggesting bears may take control of the market.


