
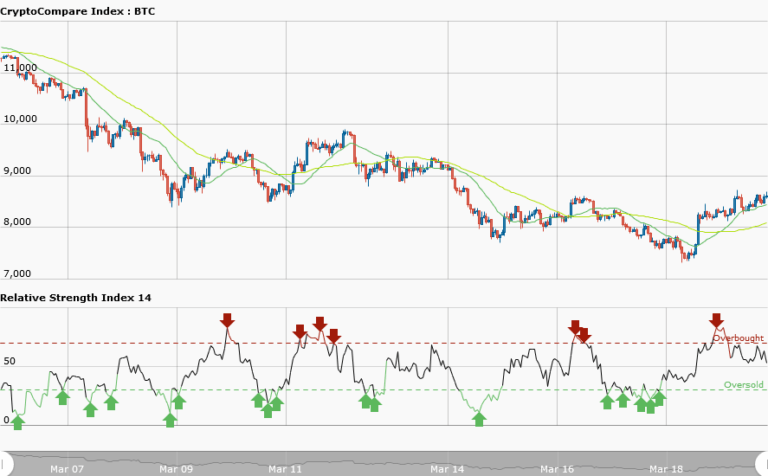

BTCUSD Medium-term Trend: Bullish
Resistance: $8,900, $8,800, $8,700
Support: $8,300, $8,400, $8,500
Yesterday, from the weekly chart, BTCUSD pair was in a downtrend with a bearish trend line showing the resistance levels of price. The price broke the trend line signaling the end of the downtrend. In view of this I expect a change in trend and Bitcoin price revisiting the previous high of $9,000. Bitcoin is presently trading at $8591 as at the time of writing.
From the weekly chart, the 20-day moving average is above the 50-day moving average; signifying that there is a bullish trend. The moving averages are all trending northwards, whereas the RSI period 14 is level 53 which indicates that average gains are higher than average losses.
BTCUSD Short-term Trend: Bullish

From the daily chart the price action shows that the price of Bitcoin is making higher highs and higher lows signaling an uptrend. The 50-day moving average and 20-day moving average are trending northwards. As a trader you can make money by buying low and selling high. Secondly, watch out for retracements or downward corrections during the course of the bull market.
When such retracements appear traders who wish to go long can enter positions when price pulls back to its support level. Meanwhile, the RSI period 14 is level 63 which indicates that price is in the bullish trend zone.


