

BTCUSD Medium-term Trend: Ranging
Resistance: $8,800, $8,600, $8,400
Support: $7,600, $7,800, $8,000
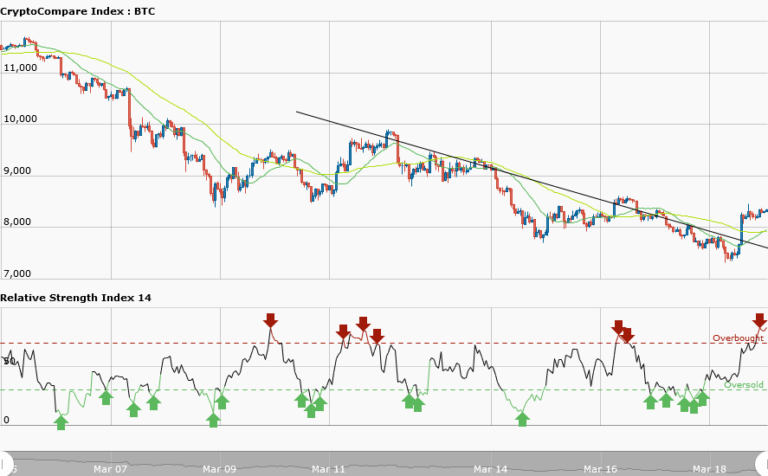
From the weekly chart, you will find the downtrend of BTCUSD pair with a bearish trend line showing the resistance levels of price. The price has broken the trend line and the candlestick opened and closed on the opposite side of the trend line but the price is in a range bound movement. This implies that we should be trading towards the next critical level of support and resistance.
A good trend line break will make the price to go far away from the trend line and enable traders make more profits. Bitcoin is presently trading at $8,410.22 as at the time of writing. I am expecting Bitcoin to revisit its previous high of $9,000. Meanwhile, the RSI period 14 is level 79 indicates that the market is overbought suggesting bears to take control of the market.
BTCUSD Short-term Trend: Ranging

From the daily chart, the price was in a range bound movement and later it rose to $8,200 on Sunday 18, to resume its range bound movement. Meanwhile, the RSI period 14 is level 49 which indicates that the price is in the range bound zone.


