

BTCUSD Medium-term Trend: Ranging
Resistance: $8,600, $8,500, $8,400
Support: $8, 000, $8,100, $ 8,200
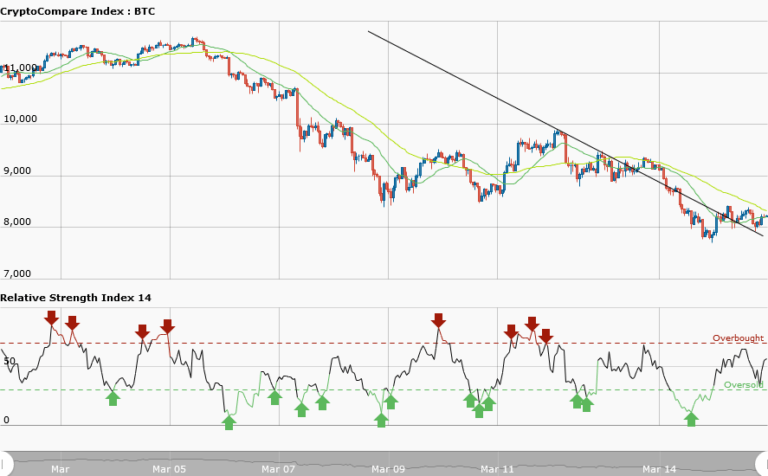
Yesterday, March 15, Bitcoin price broke the support level of $8,500 and fell to a low of $7,756.58. This was as a result of a planned ban on online advertisement promoting cryptocurrencies and related products with effect from June 2018. However, yesterday, the RSI period 14 indicated that the market was oversold suggesting bulls taking over the market. In the same vein bearish traders were advised to exit their positions.
Today, from the weekly chart the price of Bitcoin has broken the bearish trend line signaling the end of the downward trend. The price has commenced moving in a range bound market and currently trading at $8,248.26. Bitcoin is trying to consolidate at the support level of $8,000 and probably revisit its previous high of $9,000.
The question is how long would this correction last since the proposed ban on online advertisement in June 2018 has started having its effect on the cryptocurrencies? There are fears that Bitcoin will revisit its February low of $6,000. Meanwhile, the RSI period 14 is level 54 which indicates that average gains are higher than average losses.
BTCUSD Short-term Trend: Ranging

Yesterday,in the daily chart, Bitcoin was bearish and was oversold according to the reading of RSI period 14 suggesting bulls taking over of the market. Today, the price of Bitcoin is in a range market oscillating between the key levels. The price is fluctuating between the resistance at $8,400 and the support at $8,000. Meanwhile, the RSI period 14 is level 61 which indicates that the price is in the bullish trend zone.


