

BTCUSD Medium-term Trend: Sideways
Resistance: $9,500, $9,400, $9,300
Support: $8,900, $9,000, $9,100
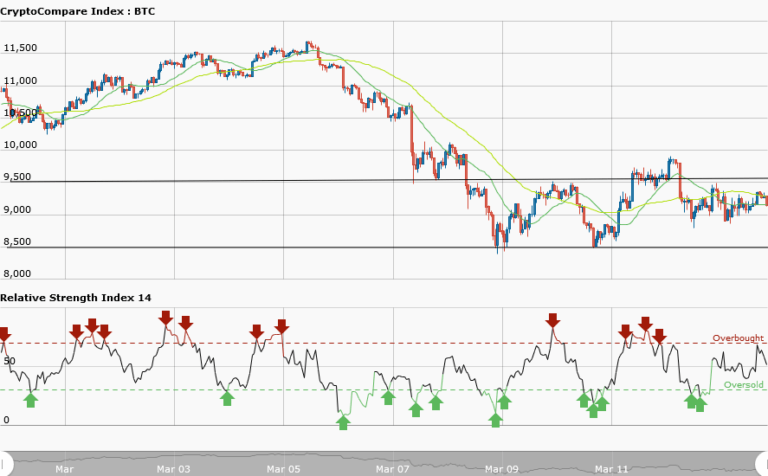
Yesterday, March 13, Bitcoin was trading in a sideways trend. The RSI period 14 also states that the market was oversold suggesting bulls taking over the market. Today, Bitcoin is still trading in a sideways trend. Bitcoin price has remained above $9,000 for the past few days after the selloff. Secondly, the price has been fluctuating between the major key levels of support at $8500 and resistance at $9,500.
If the price falls below $9,000 it will retest its previous low of $8,500 but if it breaks the resistance at $9,500 then it will rally to its previous high of $10,000. Presently, it is trading at $9,176.27. The market is not tradable because it is moving in a horizontal pattern. Meanwhile, the RSI period 14 is level 51 which indicates that the average gains are higher than average losses.
BTCUSD Short-term Trend: Sideways

In the short term trend, daily chart shows price in a sideways trend. The price is moving sideways between the levels of support at $8900 and resistance at $9,300.The daily chart has choppy price action because the price is not evenly apart to effect any reasonable trading. The price is moving horizontally; therefore you may wish to suspend trading. Meanwhile, RSI period 14 is level 60 which indicates that the price is in the bullish trend zone.


