

.
BTCUSD Medium-term Trend: Sideways
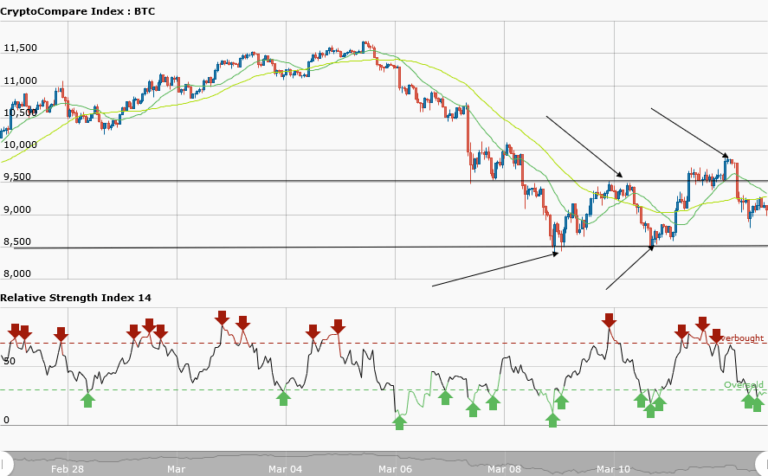
Resistance: $9,600, $9,400, $9,200
Support: $8,400,000, $8,600, $8,800
Yesterday, March 12, BTCUSD pair was moving in a sideways (ranging) trend. The price was oscillating between the support at $8,500 and the resistance at $9500. The market was overbought as per RSI period 14 reading suggesting bears to take control of the market. Today, Bitcoin is still in a sideways trend and the bears actually took the market after it was overbought yesterday.
It was trading at $9,604.51 yesterday but the bears took the price to $9,173.54 as at the time of my writing. The sideways trend may continue for now and if it does you may wish to trade the trend. That is when the price gets to the resistance level you place a short trade and exit near the support zone. Similarly, you place a long trade at the support level and exit near the resistance zone.
Meanwhile, the RSI period 14 is level 27 indicates that the market is oversold suggesting bulls taking over the market.
BTCUSD Short-term Trend: Sideways

In the short term trend, Bitcoin is in a sideways trend but it has choppy price action. The price is moving sideways but in a horizontal pattern. Traders may suspend trading the choppy price action because the market is not ranging. A ranging market is where the price is oscillating evenly between the resistance and support levels. Meanwhile, the RSI period 14 is level 26 which indicates that the market is oversold suggesting bulls takeover.


