ZECUSD Medium-term Trend: Bullish
Supply levels: $410, $400, $390
Demand levels: $350, $360, $370
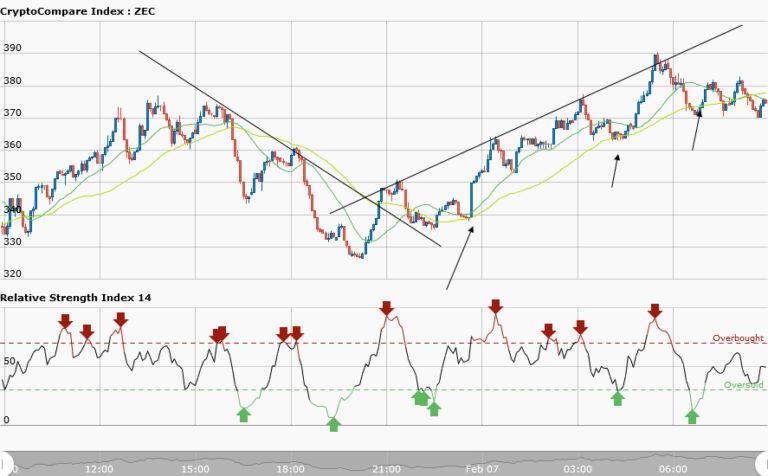
Yesterday, ZECUSD pair was in a bearish trend when the price broke through a major trend line to form a new trend. The pair was trading at $347.08 per one ZEC but presently trading at $378.05. This is about 8.9% price appreciation.
The medium term market is a bullish trend. The 50-day moving average and 20-day moving average are trending northwad confirming the trend. The first trend was a downtrend which was terminated when the price broke through the trend line to form a bullish trend .You can see the bullish trend with the arrows at the support.
In a bullish trend traders can place trades at the support so that they can profit from the trend. The arrows are pointing to the support areas where long trades can be placed. Then you can take your profits at the resistance level.
ZECUSD Short-term Trend: Bearish
The short term trend is bearish though it started as a bullish trend. The 20-day moving average is below the 50-day moving average and trending southward whereas the RSI period 14 is below 30 indicating that the market is oversold.


