

ZECUSD Long-term Trend: Bearish
Supply levels: $450, $400, $350
Demand levels: $200, $250, $300
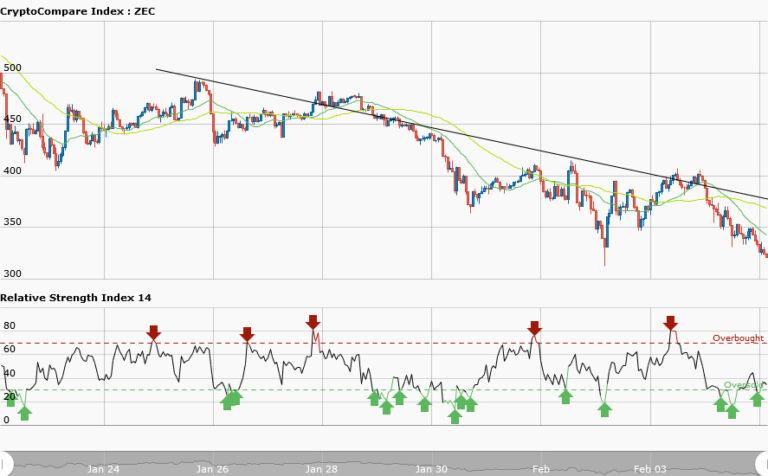
Last week, at the beginning of February, 2018 the market has been bearish. This week the market will still be bearish because of the establishment of a downtrend. Just take a look at the chart, you will find a trend line drawn across the price bars. To confirm a real trend the trend line must overlap the price bars several times.
Traders can now take short trade in the direction of the trend pending when the price will stabilize. However, the 50-day moving average and the 20-day moving average are trending southward. For you to determine when the trend will end, you have to look for price rejection or exhaustive candlestick pattern at the demand levels of $200, $250, or $300 to take a long trade.
Nevertheless, the RSI period 14 is below 30 indicating that the market is oversold.

ZECUSD Medium-term Trend: Bearish
Last week the market has been bearish with the commencement of a downtrend. A trend line has been drawn on the daily time frame showing a smooth downtrend. Traders should not trade against the trend in a trending market. The RSI period 14 is below 30 indicating that the market is oversold. The price has fallen to $317.89 as at today; therefore the demand levels may be breached.


