

ZECUSD Medium-term Trend: Sideways
Supply levels: $420, $415, $410
Demand levels: $390, $395, $400
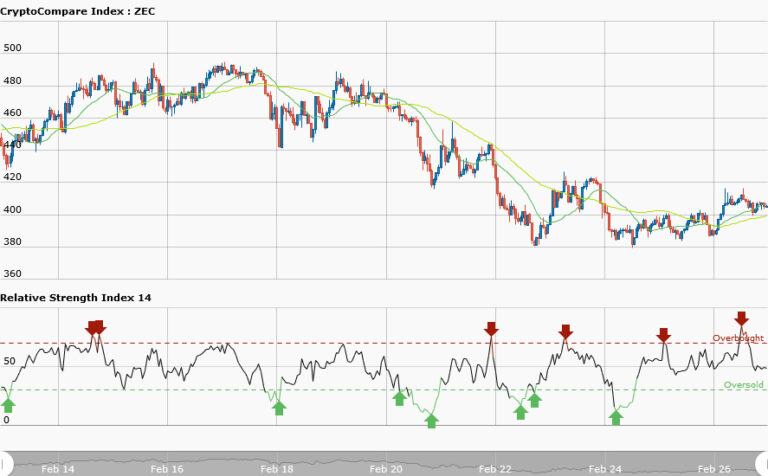
In the weekly chart, ZECUSD pair shows a downtrend in the previous days and now a sideways movement in the current days. The Zcash is trading at $405.10 at the time of writing. The 50-day moving average and 20-day moving average are trending sideways. While RSI period 14 is level 49 which indicates that price is in the sideways trend zone. Trading is unnecessary at this point in time .
ZECUSD Short-term Trend: Sideways

In the short term trend, ZECUSD pair shows price horizontally. Traders may not have the opportunity of trading the market. Daily chart shows Zcash is in a choppy market.The key levels of resistance and support are not evenly apart where the price can oscillates; this makes trading difficult. For you to trade sideways market it must be ranging. That is the price must oscillate to and fro the key levels at a good distance.
At the same time the resistance and support levels should be evenly apart. The 50-day moving average and 20-day moving average are trending sideways whereas RSI period 14 is level 51 indicates that price is in the sideways trend zone.


