
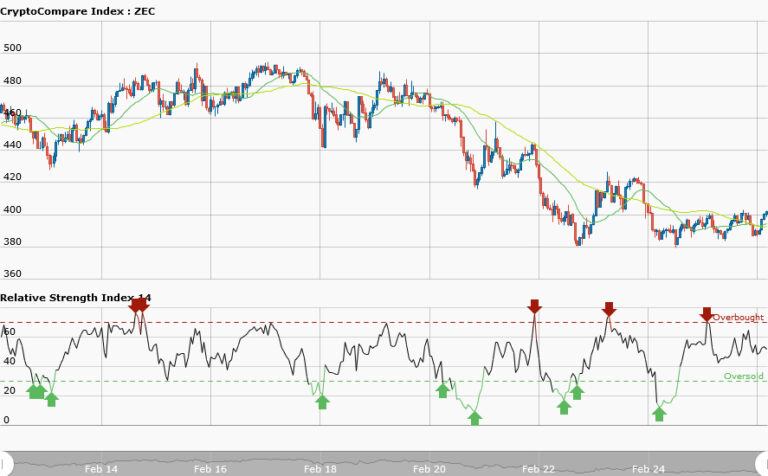

ZECUSD Medium-term Trend: Bearish
Supply levels: $420, $415, $410
Demand levels: $390, $395, $400
Last week the ZECUSD pair has been in a sideways movement for many days with last Monday’s price at $476.58.
The decline in price of other crypto currencies, volatility and fluctuations in price has affected the price of Zcash.However, today the pair is trading at $402.63 in a bearish market. The 50-day moving average and 20-day moving average are trending southward whereas RSI period 14 is level 53 which indicates that average gains are higher than average losses.
ZECUSD Short-term Trend: Bullish

In the shorter term trend, Zcash is in a bullish trend.The moving averages are below the candlesticks indicating that price is rising. Traders are to take advantage of the rising prices by looking for buy setups to place long trades. In other words, when you are in an uptrend the price will always retrace or pullback signaling a buy setup.Then you will have the opportunity of placing your long trades.
The 50-day moving average and 20-day moving average are trending northward whereas RSI period 14 is level 75 indicating that the market is overbought.


