

ZECUSD Medium-term Trend: Bullish
Supply levels: $440, $430, $430
Demand levels: $380, $390, $400
In the daily chart, ZECUSD pair is trading at $406.24 in a bullish trend. From the chart the pair has appreciated to a recent high of $420 and retraced to a low of $410 to resume its uptrend. Traders can profit from the uptrend in the following ways. First recognize that you are in an uptrend. An uptrend is when prices make a series of higher highs (HH) and higher lows (HL).
Secondly, in an uptrend the market will always retrace back to the previous swing point and then bounce higher to resume the uptrend. These are swing points to lookout for to place your long trades. Thirdly, you can follow the familiar logic of buying low and selling high.
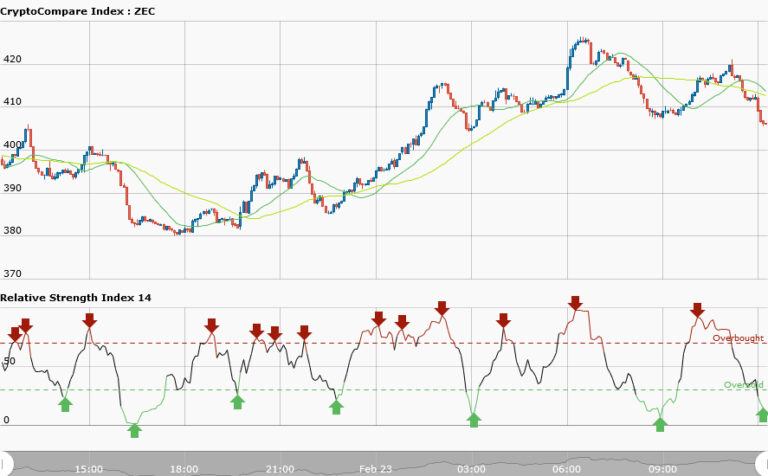
ZECUSD Short-term Trend: Bearish

In the short term trend, ZECUSD pair is bearish. The 50-day moving average and 20-day moving average are trending southward. While RSI period 14 is level 21 which indicates that the market is oversold suggesting bulls taking over the market.


