

ZECUSD Medium-term Trend: Sideways
Supply levels: $445, $440, $435
Demand levels: $415, $420, $425
ZECUSD pair has been in sideways market for days now. As the price fluctuates in a sideways market it gradually declines.
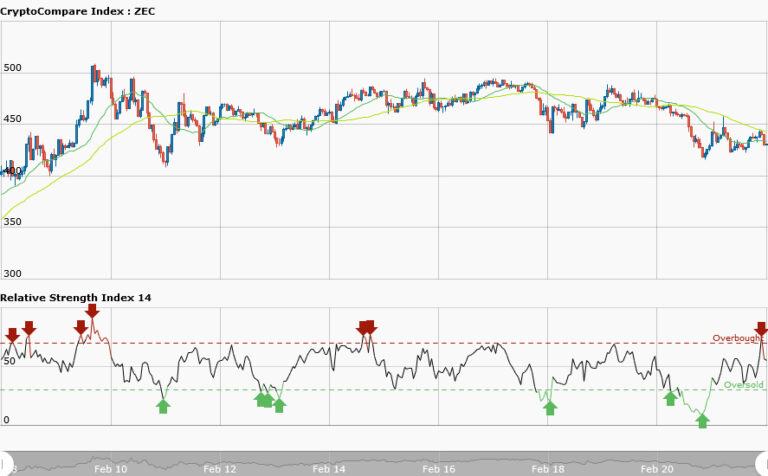
Yesterday, the price closed at $435.79 but it is still trading at $431.02 today. Traders should suspend trading because the weekly chart is choppy. However, the 50-day moving average and the 20-day moving average are trending sideways like a horizontal line whereas the RSI period 14 is level 57 suggesting that average gains are higher than average losses
ZECUSD Short-term Trend: Sideways

Yesterday the short term trend had a bearish outlook. That in a downtrend they can follow the familiar logic of buying low or selling high. At other times they could use Fib tool in a downtrend if prices retrace from a recent low a resistance level would be created thereby giving traders opportunity to short. However, today the short trend shows a sideways trend.
The price fell from $455 to $420 and commenced a sideways movement almost touching the support level before rising to the resistance.Sideways market will make you lose your profits to the market. However, the RSI period 14 is level 13 which indicates that the market is oversold.


