

ZECUSD Medium-term Trend: Sideways
Supply levels: $460, $450, $440
Demand levels: $410, $420, $430
ZECUSD pair has been in sideways market for days now. As the price fluctuates in a sideways market it gradually declines. Yesterday, the price closed at $477.08 but it is still trading at $435.79 today. Presently, the weekly chart shows a sideways trend showing prices on a horizontal line. The key levels of resistance and support which is the bases of technical analysis are not discernible.
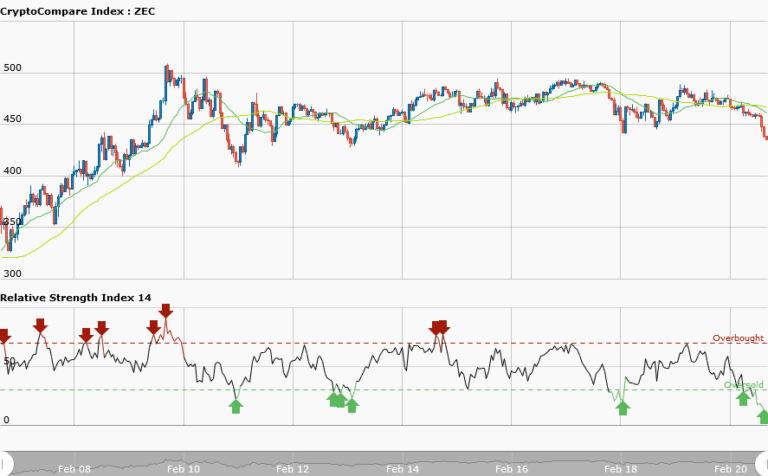
Therefore, trading on the weekly chart should be suspended.However, the 50-day moving average and the 20-day moving average are trending sideways like a horizontal line whereas the RSI period 14 is level 18 which indicates that the market is oversold.
ZECUSD Short-term Trend: Bearish

The short term trend has a bearish outlook. The daily chart is showing prices moving downwards. A downtrend is present when prices make a series of lower highs (LH) and lower lows (LL).In a trending market, you can adopt Fibonacci retracement tool to your trading. In a downtrend if prices retrace from a recent low a resistance level would be created thereby giving traders opportunity to short. You can follow the familiar logic of buying low and selling high.
The RSI period 14 is level 16 indicates that the market is oversold suggesting bulls control.


